Two hundred and sixteen new packages were added to CRAN in March. The following are my picks for the Top Forty, organized into five categories: Bioscience, Data, Data Science, Statistics and Utilities.
Bioscience
BioInstaller v0.0.3: Provides tools to install and download massive bioinformatics analysis software and database, such as NGS analysis tools with its required database or/and reference genome.
DSAIDE v0.4.0: Provides a collection of Shiny Apps that allow users to simulate and explore infectious disease transmission. The vignette will get you started.
treespace v1.0.0: Provides tools for the exploration of distributions of phylogenetic trees. This package includes a Shiny interface which can be started from R. There are vignettes for Dengue trees, Transmission trees, and for exploring landscapes of phylogenetic trees. The following plot from the vignette shows clusters of similar trees.
library(treespace)
data(woodmiceTrees)
wm.res <- treespace(woodmiceTrees,nf=3)
wm.groves <- findGroves(wm.res, nclust=6)
plotGrovesD3(wm.groves)
Data
cropdatape v1.0.0: Provides access to data from the Agricultural Ministry of Peru.
rdataretriever v1.0.0: Provides R access to the Data Retriever command line interface that automates the tasks of finding, downloading, and cleaning public datasets.
rnaturalearth v0.1.0: Provides functions to fetch Natural Earth map data. There is an introduction and a vignette on working with countries.
ropercenter v0.1.0: Provides registered users with programmatic, reproducible access to data sets from The Roper Center for Public Opinion Research, which maintains the largest archive of public opinion data in existence. The vignette shows how to get started.
statsgrokse v 0.1.4: Provides an API for the server containing Wikipedia Page View Statistics for the years 2008 to 2015.
ukds v0.1.0: Enables reproducible, programmatic retrieval of datasets from the UK Data Service. The vignette shows how to setup and use it.
Data Science
anomalyDetection v0.1.1: Implements procedures to aid in detecting network log anomalies. The vignette provides examples.
kerasR v0.4.1: Provides an interface to the Keras Deep Learning Library, which provides specifications for describing dense neural networks, convolution neural networks (CNN), and recurrent neural networks (RNN) running on top of either TensorFlow or Theano. The vignette contains examples.
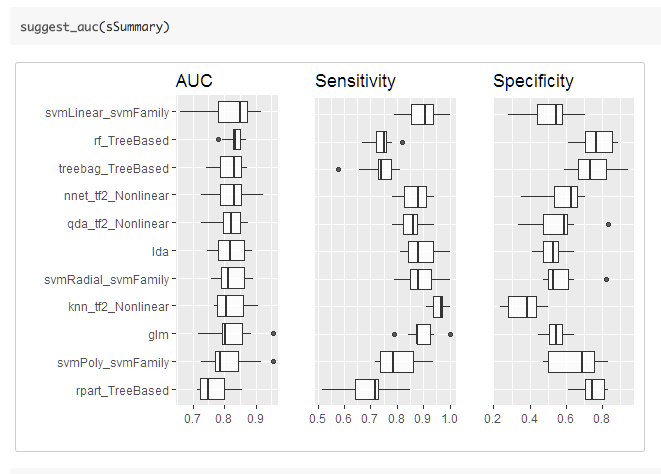
modeval v0.1.2: Allows users to easily compare multiple classifications models built with caret functions for small data sets. The vignette provides examples.

supc v0.1: Implements the self-updating process clustering algorithms proposed in Shiu and Chen. The vignette contains examples.
tensorflow v0.7: Provides an interface to TensorFlow, an open-source software library for numerical computation using data flow graphs.
Statistics
frailtyEM v0.5.4: Contains functions for fitting shared frailty models with a semi-parametric baseline hazard using the Expectation-Maximization algorithm. The vignette explains the math.
FRK v0.1.1: Provides functions to build, fit and predict spatial random effects, fixed rank kriging models with large datasets. The vignette introduces the theory and shows some examples.
hmi v0.6-3: Allows users to build single-level and multilevel imputation models using functions provided, or functions from the mice and MCMCglmm packages. There is a vignette.
margins v0.3.0: Ports Stata’s
marginscommand for calculating marginal (or partial) effects. There is an introduction, a vignette on the Technical Implementation Details, and a comparison with the Stata Command.mlrMBO v1.0.0: Provides a toolbox for Bayesian, model-based optimization. There is an introduction and vignettes for Mixed Space Optimization, Noisy Optimization, and Parallelization.

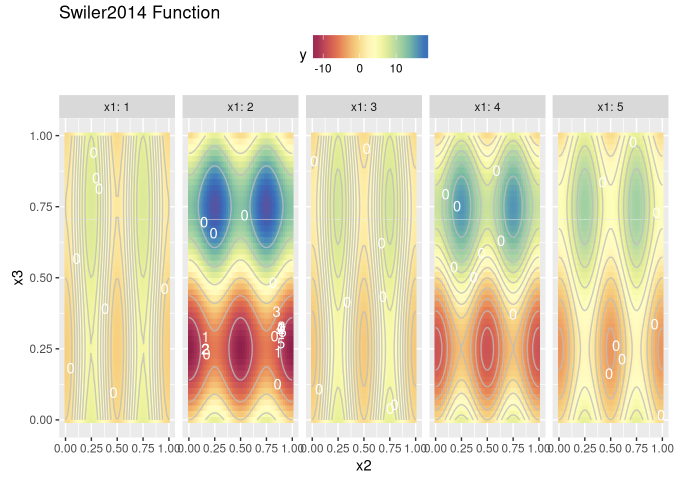
MonteCarlo v1.0.0: Simplifies Monte Carlo simulation studies by providing functions that automatically set up loops to run over parameter grids, parallelize the computations, and generate output in LaTeX tables. The vignette shows how to use it.
RankingProject v0.1.1: Provides functions to generate plots and tables for comparing independently sampled populations. There is an introduction and a vignette that reproduces the figures from “A Primer on Visualizations for Comparing Populations, Including the Issue of Overlapping Confidence Intervals” by Wright, Klein, and Wieczorek (2017, The American Statistician, in press).
rjmcmc v0.2.2: Provides functions to perform reversible-jump MCMC with the restriction introduced by Barker & Link. The vignette shows how to calculate posterior probabilities from the MCMC output.
Utilities
canvasXpress v1.5.2: Enables creation of visualizations using CanvasXpress, a stand-alone JavaScript library for reproducible research. The vignette shows how to get started.
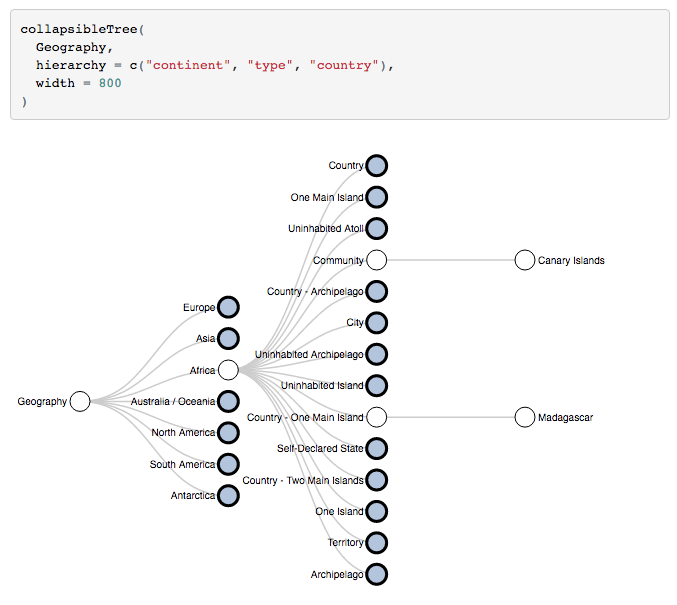
collapsibleTree v0.1.4: Provides functions to build interactive Reingold-Tilford tree diagrams created using D3.js, where every node can be expanded and collapsed by clicking on it. There are some examples on the GitHub site.

cronR v0.3.0: Allows users to schedule R scripts and processes on Unix/Linux systems, while taskscheduleR allows the same from Windows. See the cronR vignette and the taskscheduleR vignette.
doctr v0.2.0: Provides tools to help check the consistency and quality of a dataset. There are vignettes for Comparing Tables, Dataset Diagnostics, and EDA Automation.
geojsonR v1.0.1: Provides functions to process GeoJson objects. The vignette gives the details.
ggedit v0.2.1: Provides an interactive layer and theme aesthetic editor for ggplot2. The ggedit gitbook explains how to use it.
implyr v0.1.0: Provides a SQL backend to dplyr for Apache Impala.
officer v0.1.0: Provides functions to manipulate Microsoft Word and Microsoft Powerpoint documents. This is a companion package to flextable.
flextable v.1.0: Includes functions to create tables in Word, PowerPoint, and HTML documents. There is an overview, and vignettes for explaining objects and table layout.
pivottabler v0.1.0: Allows users to create complex pivot tables and pivot tables with irregular layouts in R. There are multiple vignettes, including an introduction, a styling guide, a Shiny example and explanations of calculations and data groups.
Polychrome v0.8.2: Provides tools for creating, viewing, and assessing qualitative palettes with many (20-30 or more) colors. There is a colorful vignette
library(Polychrome)
pal2 <- alphabet.colors(26)
rancurves(pal2)
RApiDatetime v0.0.3: Provides a C-level API to allow packages to access C-level R date and datetime code.
Rcssplot v0.2.0.0: Provides tools to style plots with cascading style sheets. The vignette shows how.
reticulate v0.7: Implements an R interface to Python modules, classes, and functions. When calling into Python, R data types are automatically converted to their equivalent Python types. When values are returned from Python to R, they are converted back to R types. There is an overview and a vignette describing arrays in R and Python
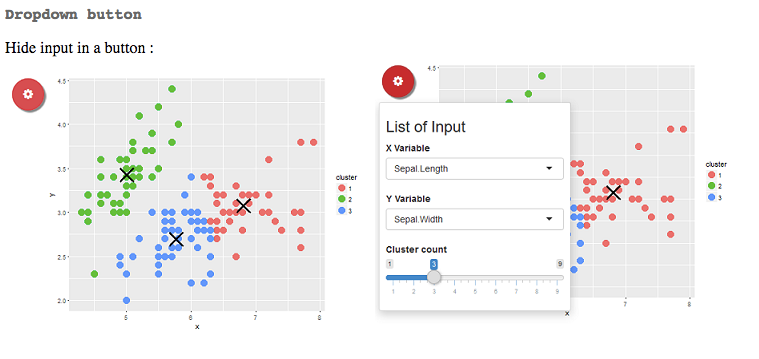
shinyWidgets v0.2.0: Provides custom input widgets for Shiny apps. See the README for examples.

shinyjqui v0.1.0: An extension to shiny that brings interactions and animation effects from the
jQuery UIlibrary. There is an introduction and a vignette with examples.valaddin v0.1.0: Provides tools to transform functions into functions with input validation checks, in a manner suitable for both programmatic and interactive use. The vignette shows how.
You may leave a comment below or discuss the post in the forum community.rstudio.com.