Two hundred twenty-two new packages made it to CRAN in May, and it was more of an effort than usual to select the “Top 40”. Nevertheless, here they are in nine categories, Computational Methods, Data, Machine Learning, Mathematics, Medicine, Science, Statistics, Utilities and Visualization.
Computational Methods
dde v1.0.0: Implements a Dormand-Prince algorithm for solving “non-stiff” differential equations. See the vignette for examples.
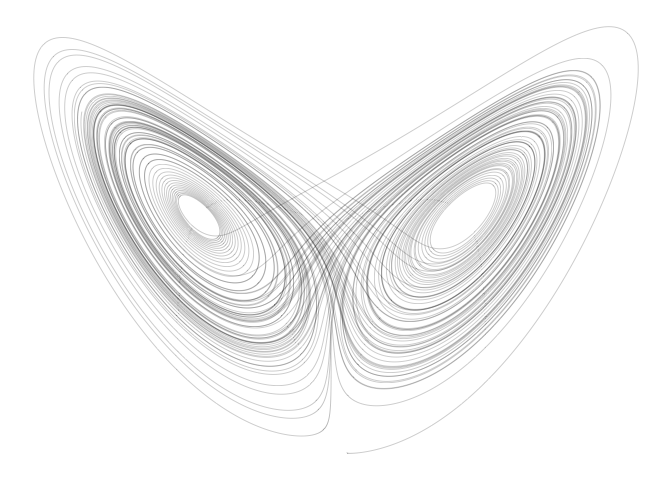
rTRNG v4.20-1: Implements an interface to Tina’s Random Number Generator C++ Library, and provides examples of how to use parallel RNG with RcppParallel. See Bauke (2018) for implementation details and the vignette for background, and useR!2017 Presentation for examples.
Data
ramlegacy v0.2.0: Provides functions to download, cache and read an Excel version of the RAM Legacy Stock Assessment Data Base, an online compilation of stock assessment results for commercially exploited marine populations from around the world. See the vignette for an introduction.
rnassqs v0.4.0: Implements an interface to the United States Department of Agricultre’s National Agricultural Statistical Service (NASS) Quick Stats API. There is a vignette showing how to use the package.
Machine Learning
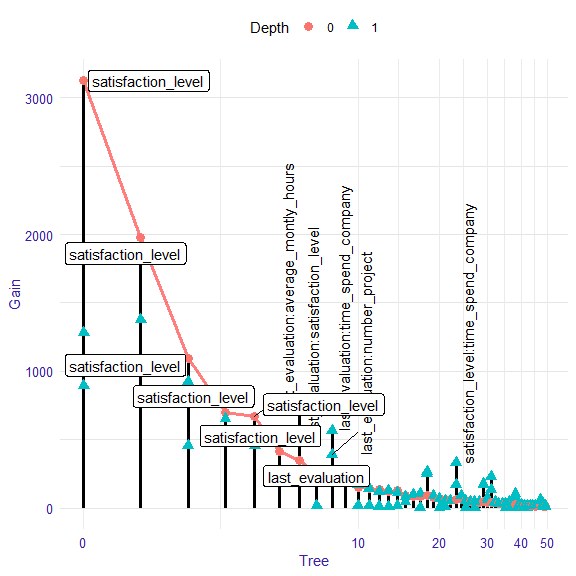
EIX v1.0 Provides functions to examine the structure and explain interactions in XGBoost and LightGBM models including functions to visualize tree-based ensembles models, identify interactions and measure variable importance. EIX is a part of the DrWhy.AI universe. There is a vignette on Explaining Interactions and another analyzing the Titanic Data.
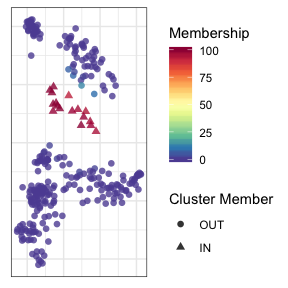
OTclust v1.0.2: Implements a mean partition for ensemble clustering by optimal transport alignment. The vignette
paws v0.1.1: An ensemble of packages including paws.compute, paws.storage, paws.database, paws.networking, paws.management, paws.machine.learning, paws.analytics, paws.security.identity, paws.application.integration, paws.cost.management, and paws.customer.engagement that provides a comprehensive interface to Amazon Web Services.
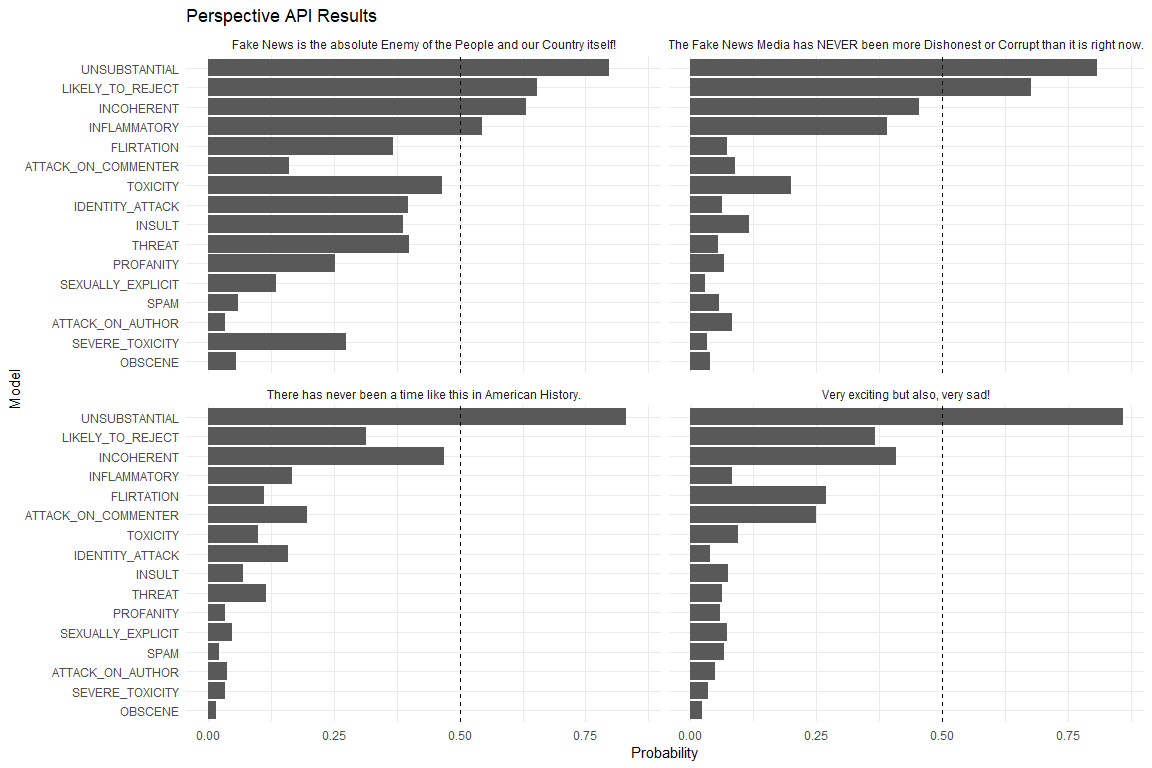
peRspective v0.1.0: Implements an interface to the Perspective API which uses machine learning models to score the perceived impact a comment might have on a conversation (i.e. TOXICITY, INFLAMMATORY, etc.). See README for an example.
SelectBoost v1.4.0: Implements the SelectBosot algorithm to enhance the performance of variable selection methods in correlated data sets. There are vignettes on Benchmarking, Confidence Estimates, Simulation Tools that are provided with the package.
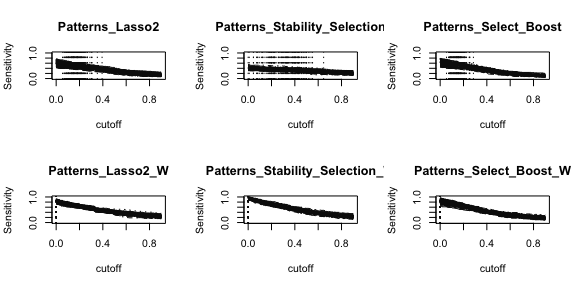
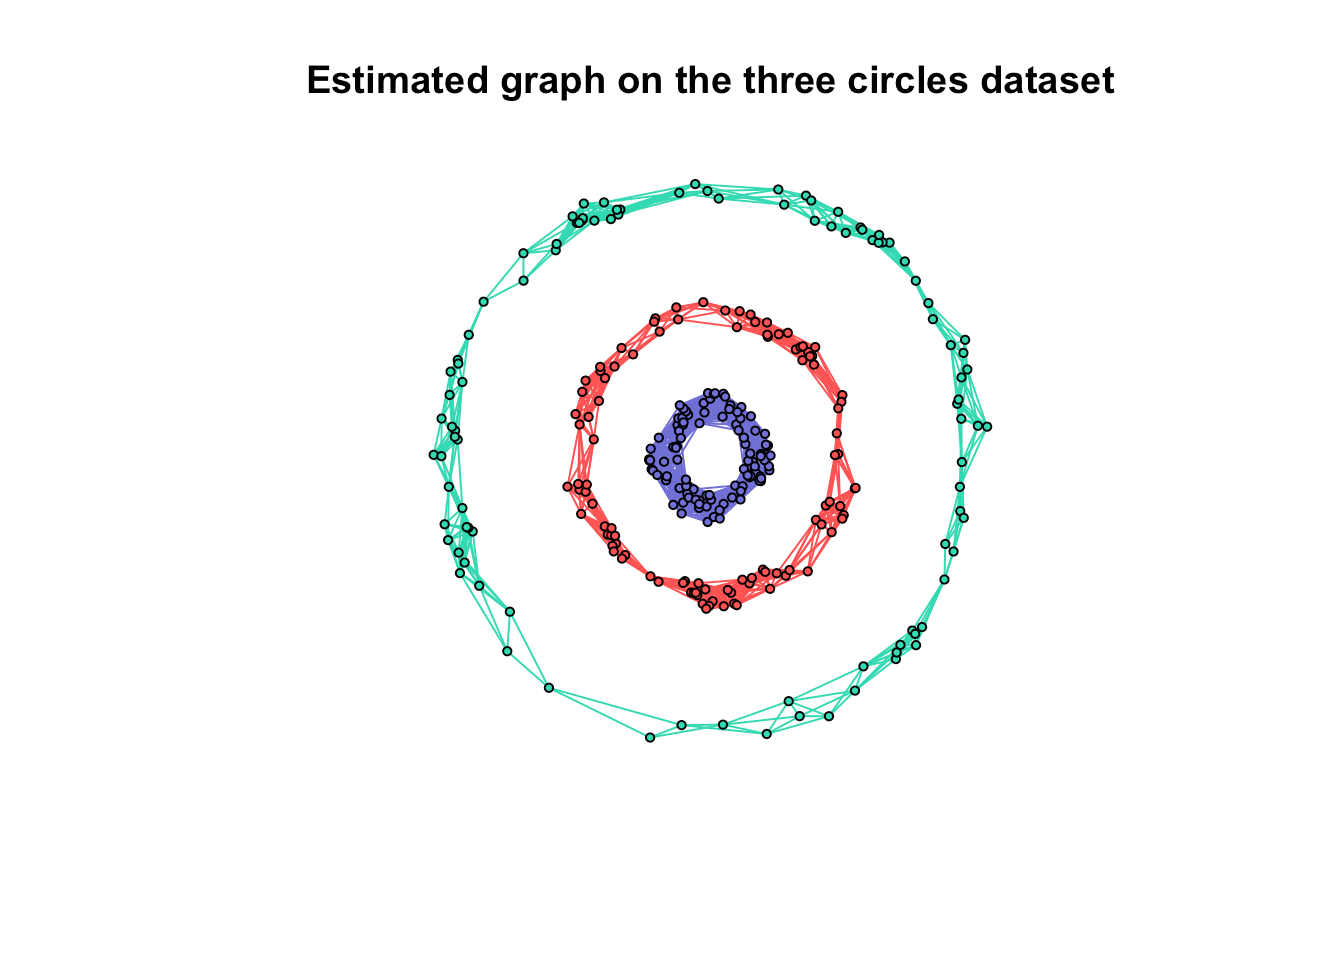
spectralGraphTopology v0.1.1: Implements block coordinate descent estimators to learn k-component, bipartite, and k-component bipartite graphs from data by imposing spectral constraints on the eigenvalues and eigenvectors of the Laplacian and adjacency matrices. This package is based on the paper by Kumar et al. (2019). There is a vignette.
Mathematics
gridBezier v1.1-1: Provides functions for rendering both quadratic and cubic Bezier curves in grid. Look here for a tutorial on variable-width Bezier Splines in R.

wedge v1.0-1: Provides functions for working with differentials, k-forms, wedge products, Stokes’s theorem, and related concepts from the exterior calculus.
Medicine
adept v1.1.2: Provides functions for analyzing high-density data from walking strides collected from a wearable accelerometer worn during continuous walking activity. There is an Introduction and a vignette on walking stride segmentation.

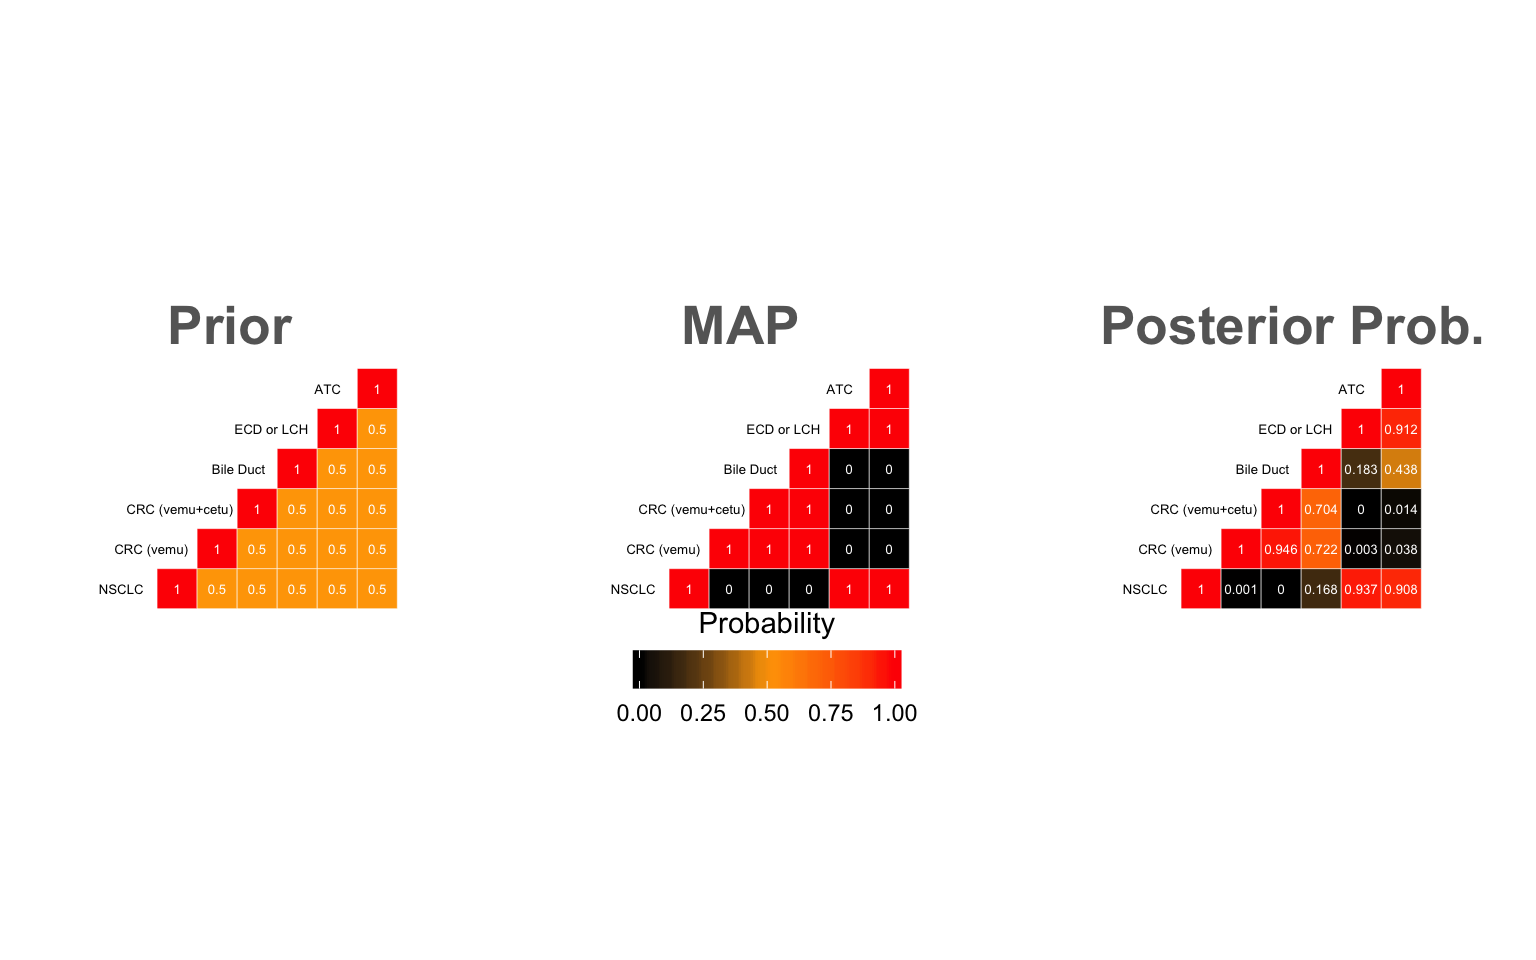
basket v0.9.2: Implementation of multisource exchangeability models for Bayesian analyses of prespecified subgroups arising in the context of basket trial design and monitoring. See Hyman et al. (20185, Hobbs & Landin (2018), Hobbs et al. (2018) and Kaizer et al. (2017) for background, and the vignette for how to use the package.
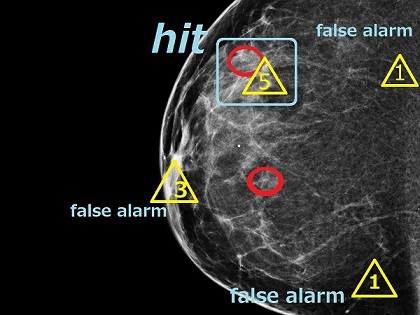
BayesianFROC v0.1.3: Implements methods for Free-response Receiver Operating Characteristic (FROC) analysis to compare performance metrics such as area under the curve (AUC) for the purpose of finding lesions in radiographs of different modalities: Resonance Imaging (MRI), Computed Tomography (CT), Positron Emission Tomography (PET), …, etc. See Chakraborty (1981) for background and the vignettes Theory of Bayesian FROC and Single Reader and Single Modality for how to use the package.
getsummary v0.1.0: Provides functions to create presentation-ready tables summarizing data sets, regression models, and more. Function defaults follow reporting guidelines outlined in Assel et al. (2019). There are tutorials on using the fmt-regression() and fmt_table1() functions.
Science
beastier v2.01.15: Implements an API to access the BEAST2 tool for Bayesian phylogenetic analysis. The vignette shows how to use the package.
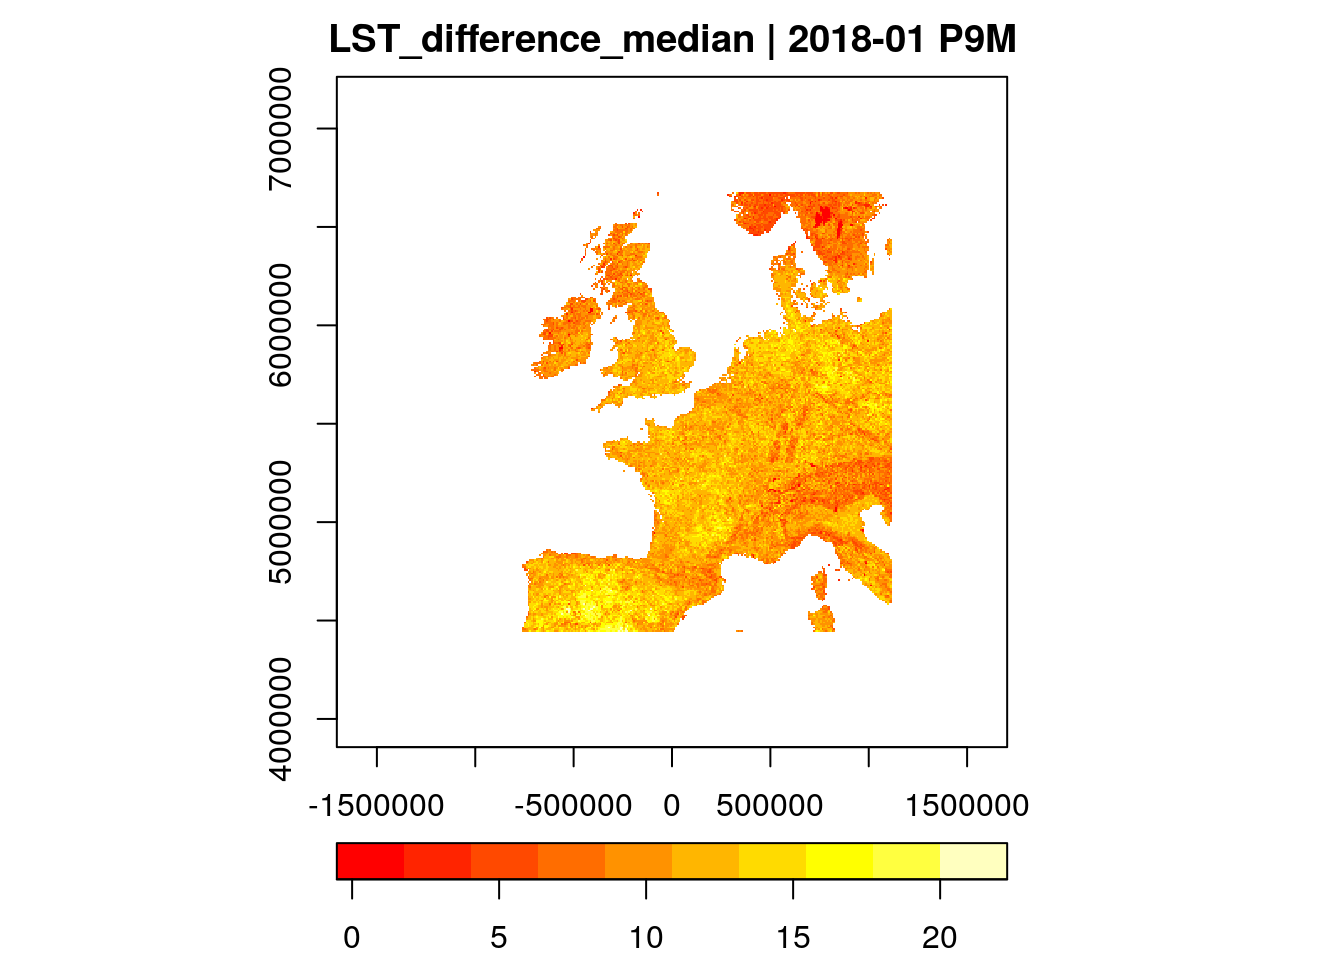
gdalcubes v0.1.0: Provides functions to process collections of Earth observation images as on-demand multispectral, multitemporal data cubes. Users define cubes by spatiotemporal extent, resolution, and spatial reference system and let ‘gdalcubes’ automatically apply cropping, reprojection, and resampling using the Geospatial Data Abstraction Library (GDAL). There is a Getting Starting Guide.
Statistics
explore v0.4.3O Provides interactive functions to facilitate exploratory data analysis. See the vignette.

Monte.Carlo.se v0.1.0: Provides functions to compute Monte Carlo standard errors for summaries of Monte Carlo output. See Boos and Osborne (2015) for background. Additionally, there is an Overview and vignettes on Creating Tables, Summary Statistics, and Pairwise Comparisons.
multinomialeq v0.2.1: Implements Gibbs sampling and Bayes factors for multinomial models with linear inequality constraints on the vector of probability parameters. See Heck and Davis-Stober (2019) for background and the vignette for an example.
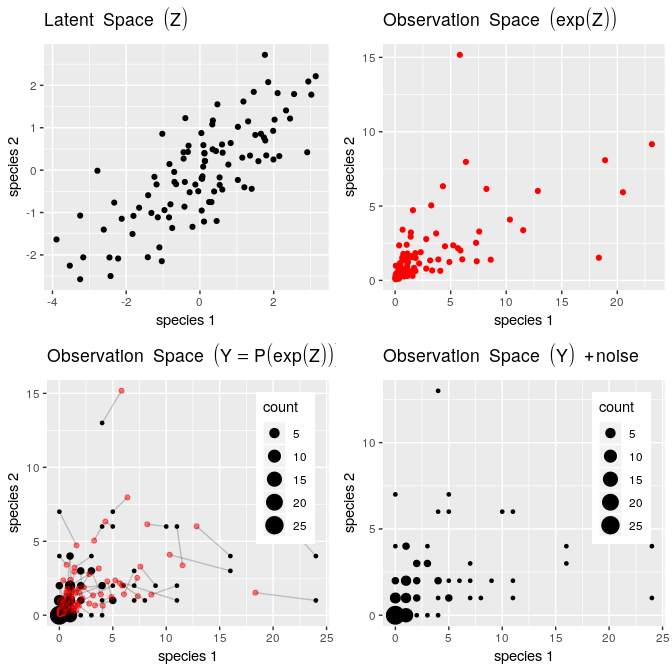
PLNmodels v0.9.2: Implements the Poisson-lognormal model which is applicable to a variety of multivariate problems when count data are at play, including principal component analysis for count data (Chiquet et al. (2018)](doi:10.1214⁄18-AOAS1177), and network inference Chiquet et al. (2018). There are vignettes for importing data, analyzing count data, classification, sparse structure estimation, PCA, and a description of the Trichoptera data set.
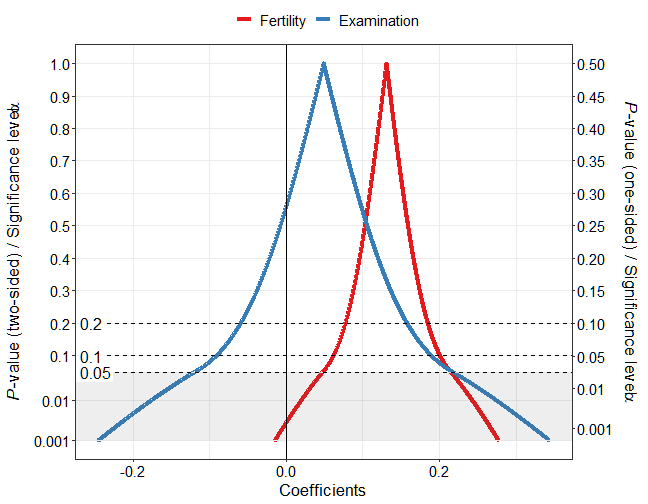
pvaluefunctions v1.2.0: Provides a function to compute and plot confidence distributions, confidence densities, p-value functions and s-value (surprisal) functions for several commonly used estimates. See Poole (1987), Schweder and Hjort (202) and Singh et al. (2007) for background, and the vignette for details of the package.
SGB v1.0: Implements multivariate regression using a generalization of the Dirichlet distribution, the Simplicial Generalized Beta distribution over the simplex space of compositions or positive vectors with sum of components equal to 1. See the vignette for details.
suddengains v0.2.1: Provides functions to identify sudden gains in longitudinal data based on the criteria outlined in Tang and DeRubeis (1999). There is a Tutorial.
Utilities
distill v0.7: Enables R Markdown formatting for web-based scientific and technical articles. Look here for documentation.
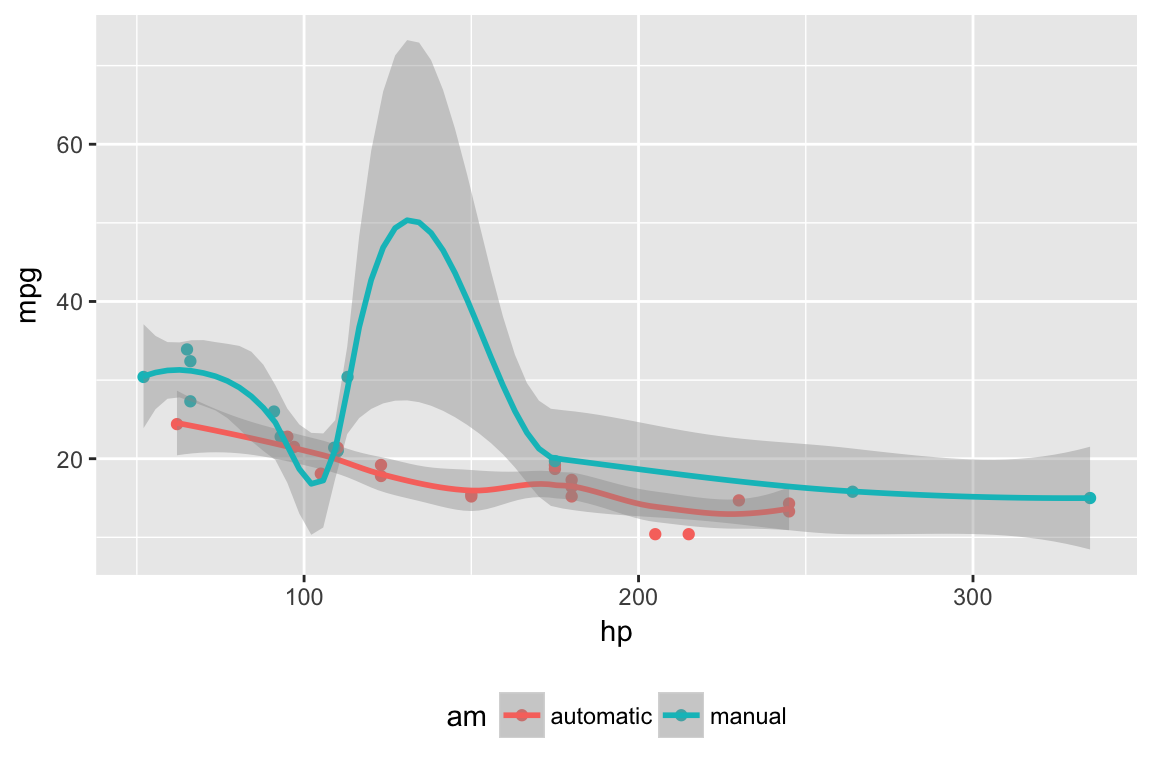
packageRank v0.1.0: Allows users to compute and visualize the cross-sectional and longitudinal number and rank percentile of package downloads from RStudio’s CRAN mirror. The documentation is on GitHub.
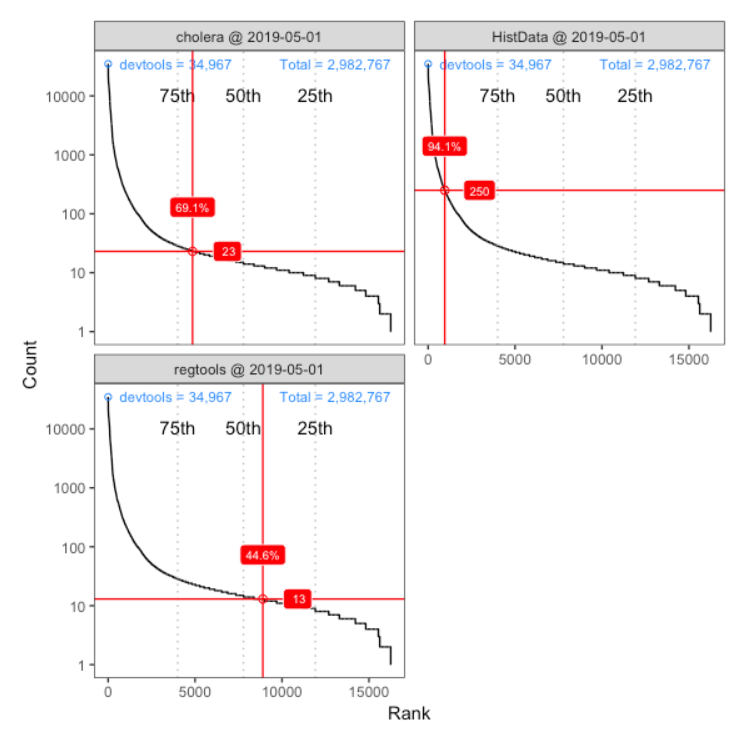
table.express v0.1.1: Offers versions of dplyr data manipulation verbs that parse and build expressions which are ultimately evaluated by data.table. See the vignette.
test2speech v0.2.4: Unifies different text to speech engines from Google, Microsoft, and Amazon by enabling users to switch between different services by setting a function argument. There is a vignette Listing out voices.
tidycode v0.1.0: Provides functions to analyze lines of R code using tidy principles allowing users to input lines of R code and output a data frame with one row per function. See the vignette for examples.
matahari v0.1.0: Allows users to spy on their R sessions by logging everything they type into the R console. See the vignette.
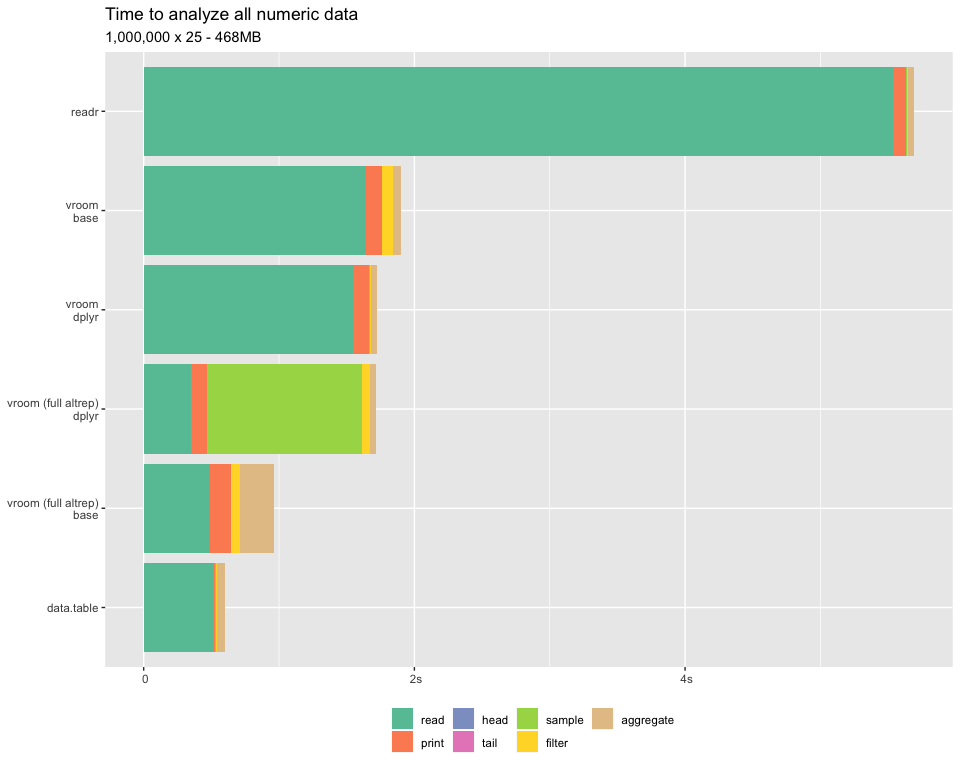
vroom v1.0.1: Uses lazy evaluation to quickly read data from csv, tsv and fwf files. There is a Getting Started Guide and a vignette with Benchmarks.
Visualization
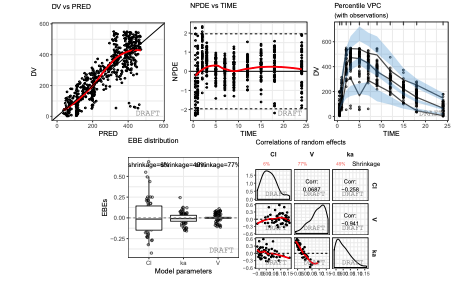
ggPMX v0.9.4: Implements a toolbox of diagnostic functions and plots for non-linear mixed effects models that produces publication ready plots. See the User Guide for details.
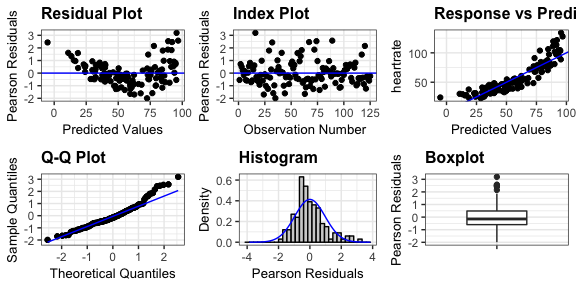
ggResidpanel v0.3.0: Provides functions to create interactive diagnostic plots and panels of diagnostic plots for residuals. See the vignette.
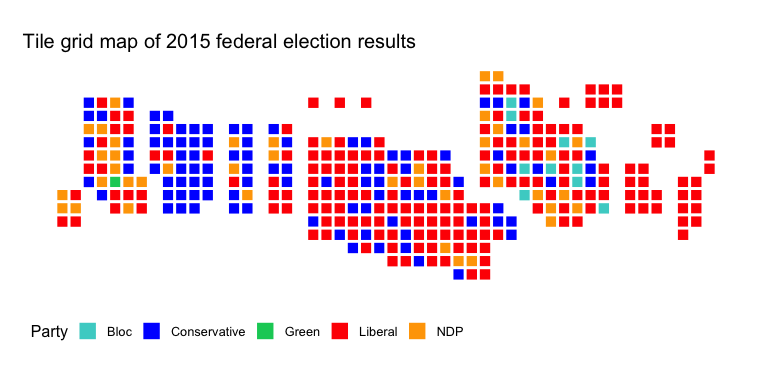
mapcan v0.0.1: Provides functions to standard choropleth maps as well as choropleth alternatives for ggplot2 that address the peculiarities of plotting statistics for Canadian data at the riding level. There is an Introduction and a vignette on the riding_binplot() function.
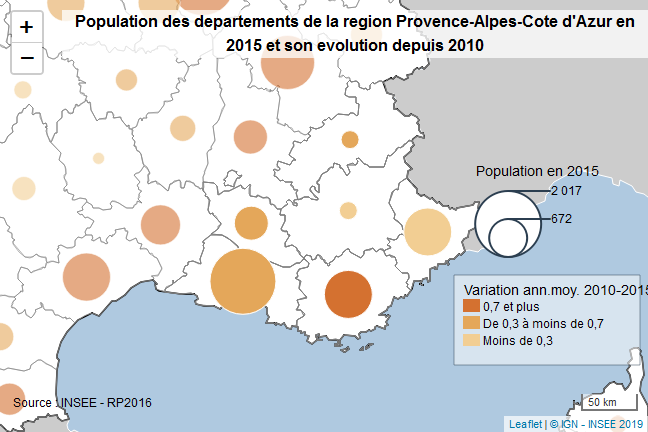
oceanis v0.8.5: Provides functions to create interactive maps for statistical analysis that may include proportional circles, chroropleths, typology and flows. The vignette is in French.
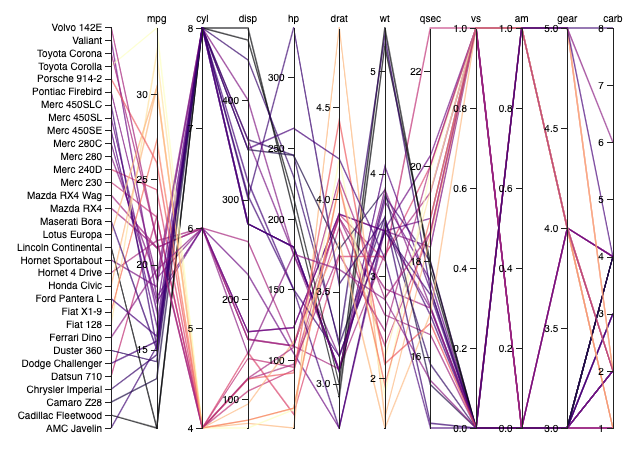
parcoords v1.0.1: Implements an htmlwidget for the d3.js parallel coordinates function parcoords-es. See the vignette
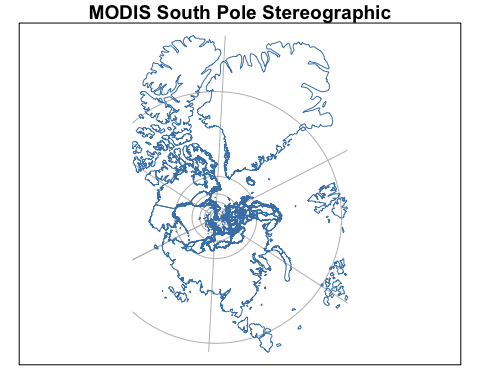
plotdap v0.0.2: Provides functions to visualize and animate data from ERDDAP servers via the rerddap package using base graphics or ggplot2. There is a vignette.
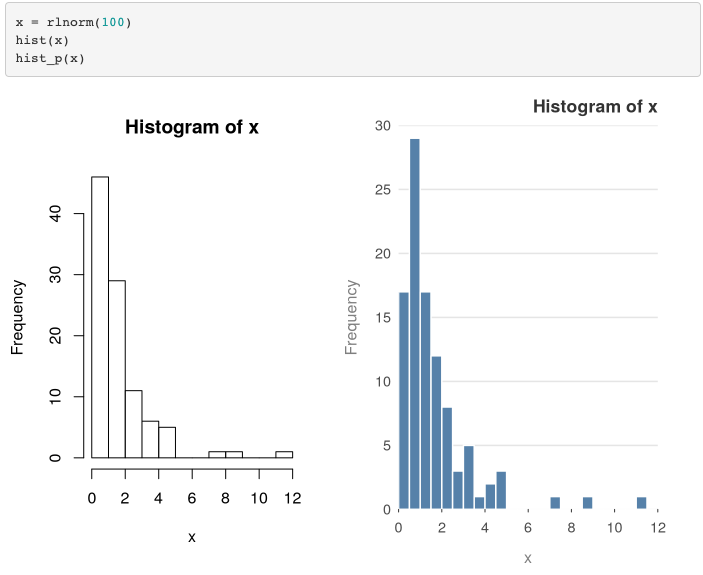
prettyB v0.2.1: Provides drop-in replacements for some standard, base R graphics functions.
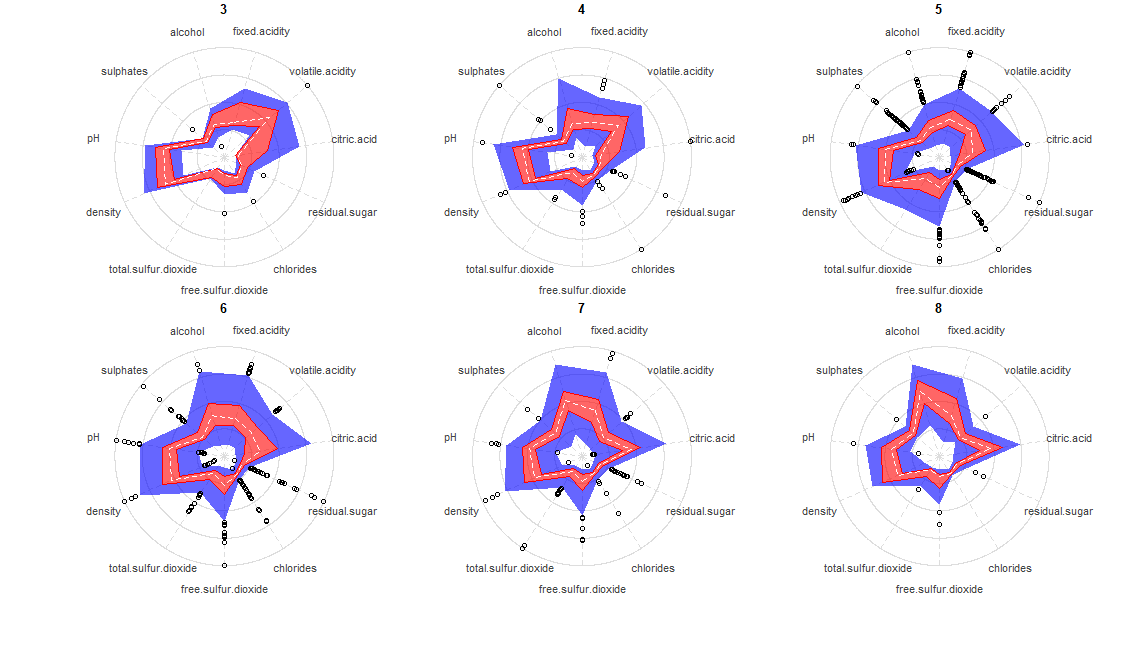
radarBoxplot v`.0.0: Creates radar-boxplots for visualizing multivariate data. See README for documentation.
You may leave a comment below or discuss the post in the forum community.rstudio.com.