August was a relatively slow month for new R packages; “only” 180 new packages stuck to CRAN. Here are my “Top 40” picks organized into seven categories: Data, Machine Learning, Miscellaneous, Science, Statistics, Utilities and Visualizations. Although they have been written for specialized audiences, I have included the three “Science” packages because, in my layman’s opinion, they not only seem to be useful, but they are each documented well enough to give an interested person some idea of what they do.
Data
edgarWebR v0.1.1: Provides methods to access and parse live filing information from the U.S. Securities and Exchange Commission, including company and fund filings, along with all associated metadata. See the vignette for an introduction. 
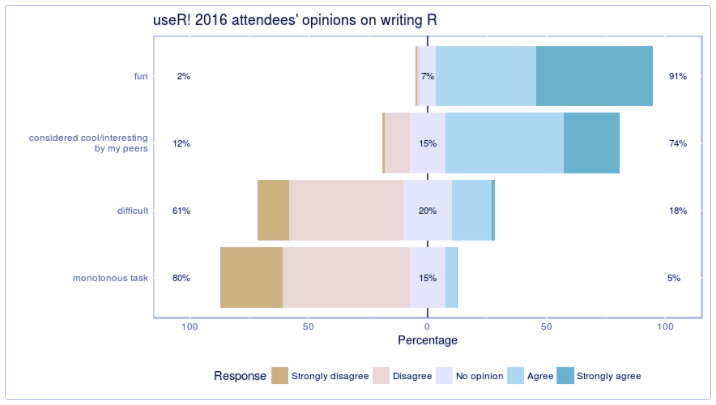
forwards v0.1.0: Anonymized data from surveys conducted by Forwards, the R Foundation task force on women and other under-represented groups. Currently, a single data set of responses to a survey of attendees at useR! 2016. The vignette provides an overview.
GeoMongo v1.0.1: Utilizes methods from the PyMongo library to initialize, insert and query ‘GeoJson’ data. There is a vignette.
Rnightlights v0.1.2: Provides an interface to extract raster and zonal statistics from satellite nightlight rasters, downloaded from the United States National Oceanic and Atmospheric Administration free data repositories.
Knoema v0.1.7: Provides an API interface to Knoema, one of the largest collections of public data and statistics on the Internet, featuring about 2.5 billion time series from thousands of sources. The README file will get you started.
rwalkr v0.3.1: Provides an API to the Melbourne pedestrian data in tidy data form. See README for an example.
vegetable v0.1.0: Provides functions to import and manipulate data from vegetation-plot databases, especially data stored in Turboveg. The package also implements import/export routines for exchanging data with Juice.
Machine Learning
partitionComparison v0.2.2: Provides several measures (dissimilarity, distance/metric, correlation, entropy) for comparing two partitions of the same set of objects. See the paper by Marina Meilă for details.
spm v1.0.0: Introduces hybrid methods of geostatistical and machine learning methods for spatial predictive modelling. The vignette provides an introduction.
Miscellaneous
LearnGeom v1.0: Provides functions for learning and teaching basic plane Geometry at the undergraduate level, with the aim of being helpful to young students with few programming skills. The vignette offers several examples.
Science
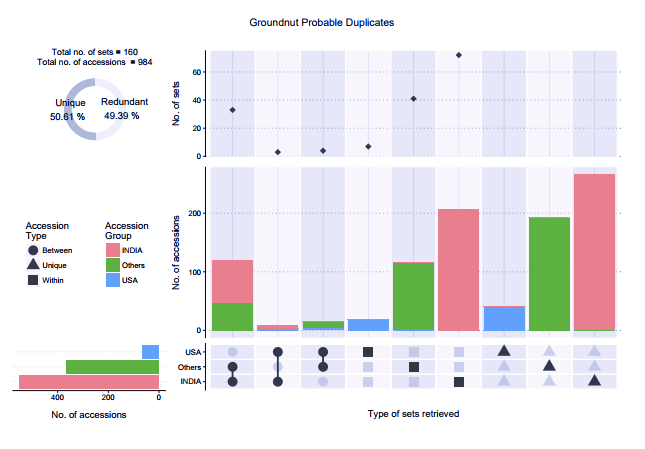
PGRdup v0.2.3.2: Provides functions to aid the identification of probable/possible duplicates in Plant Genetic Resources collections using ‘passport databases’ comprising information records from each constituent sample. The vignette provides an overview.
rtimicropem v1.3: Supports the input and reproducible analysis of RTI MicroPEM output files such as those produced by the Chai Project. There is an Introduction and a vignette on MicroPEM Cleaning.
snpReady v0.9.3: Provides functions to clean, summarize and prepare genomic data sets to Genome Selection and Genome Association analysis and to estimate population genetic parameters. See the vignette for details.
Statistics
blink v0.1.0: Implements the model in Steorts, which performs Bayesian entity resolution for categorical and text data, for any distance function defined by the user. Reproducible experiments are illustrated in the vignette.
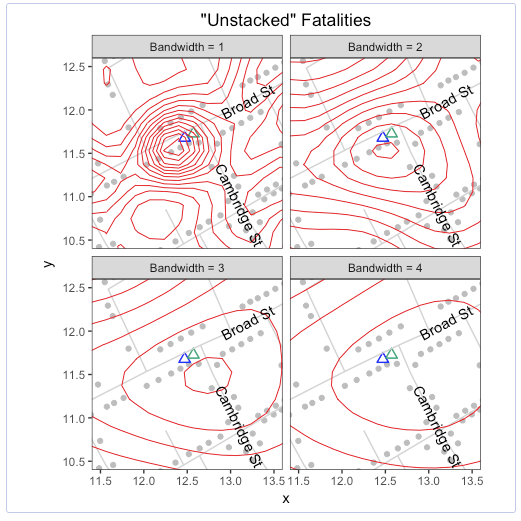
cholera v0.2.1: Amends errors, augments data and aids analysis of John Snow’s map of the 1854 London cholera outbreak. The original data come from Rusty Dodson and Waldo Tobler’s 1992 digitization of Snow’s map. Those data are no longer available. However, they are preserved in the HistData package. There are vignettes on Missing Data, Pump Neighborhoods, Roads, Time Series, and “Unstacking bars”.
drtmle v1.0.0: Provides targeted minimum loss-based estimators for counter-factual means and causal effects that are doubly robust with respect both to consistency and asymptotic normality van der Laan. The extensive vignette does the math.
esvis v0.1.0: Provides a variety of methods to estimate and visualize distributional differences in terms of effect sizes, with emphasis on evaluating differences between two or more distributions across the entire scale, rather than at a single point (e.g., differences in means). Look here for an example.

fuser v1.0.0: Provides functions for high-dimensional penalized regression across heterogeneous subgroups. The underlying model is described in detail in Dondelinger and Mukherjee. The vignette shows how to use the package for prediction over subgroups.
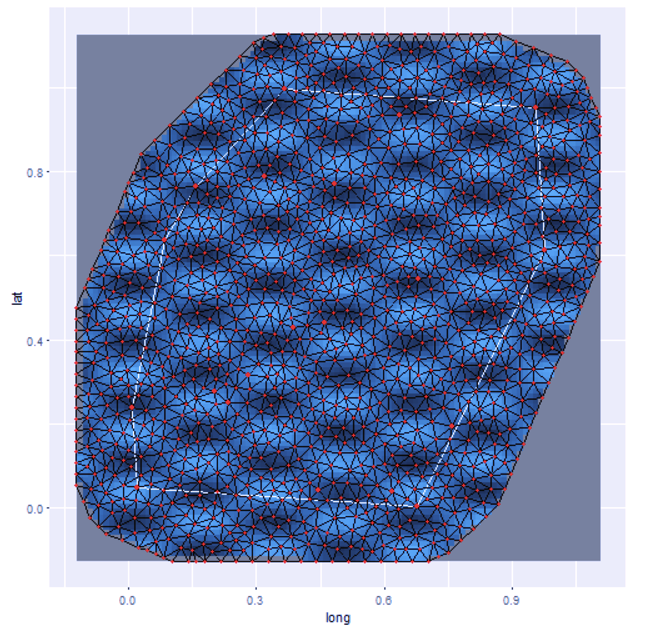
gamlss.spatial v1.3.4: Provides functions to fit Gaussian Markov Random Fields within the Generalized Additive Models for Location Scale and Shape algorithms. The vignette introduces the package and provides several examples.
INLAutils v0.0.4: Provides a number of utility functions for solving models using the Integrated Nested Laplace Approximation INLA, a new approach to statistical inference with latent Gaussian Markov random fields (GMRF). Look here for examples and plots.
missRanger v1.0.0: Provides an implementation of the MissForest algorithm for imputing mixed-type data sets by chaining tree ensembles that was introduced by Stekhoven and Buehlmann. Look here for an example.
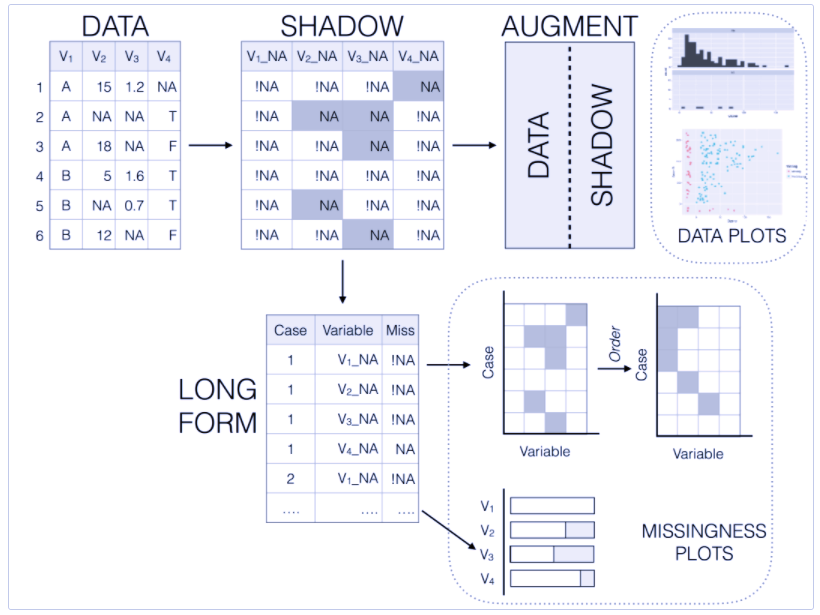
naniar v0.1.0: Provides data structures and functions that facilitate the plotting of missing values and examination of imputations. There is a Getting Started Guide and a Gallery of Missing Data Visualizations.
powdist v0.1.3: Provides density, distribution, and quantile functions, as well as a function for random draws from power and reversal power distributions.
RATest v0.1.0: Provides a collection of randomization tests, data sets, and examples currently focusing on permutation tests for baseline covariates in the sharp regression discontinuity design. See Canay and Kamat and the vignette.
skpr v0.35.1: Is an open-source design of experiments suite, for generating and evaluating optimal designs in R. The README file shows how to get started. 
Utilities
blastula v0.1: Allows users to compose and send HTML email messages that render across a range of email clients and device sizes. Messages are composed using Markdown and a text interpolation system that allows for the injection of evaluated R code within the message body. The README file describes how to use the package.
blogdown v0.1: Enables users to write blog posts (like this one) and web pages in R Markdown. This package supports the static site generator Hugo best, but it also supports Jekyll and Hexo.
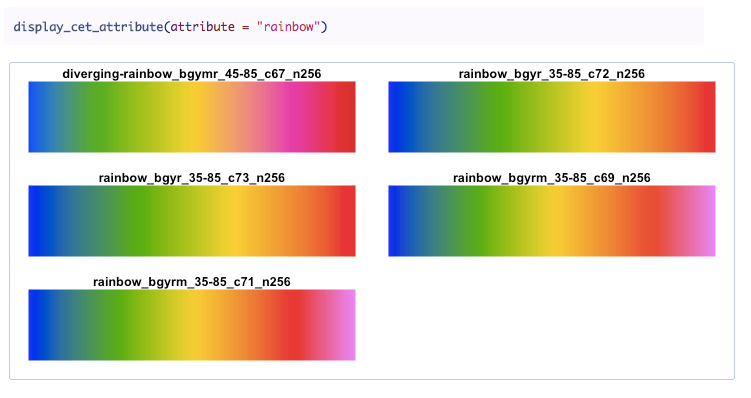
cetcolor v0.1.0: Offers a collection of perceptually uniform colour maps described by Peter Kovesi in the paper Good Colour Maps: How to Design Them. The vignette shows several examples.
googledrive v0.1.1: See the googledrive website for an example and instructions for getting started with the package.
pointblank v0.1: Provides functions to validate data in local data frames, local tibble objects, in csv and tsv files, and in PostgreSQL and MySQL database tables. Look at the README file for an example.
reqres v0.2.0: Provides functions to facilitate parsing of HTTP requests, creation of appropriate responses, and handling of the housekeeping involved in working with HTTP exchanges. See README to get started.
rmapzen v0.3.3: Provides an interface to the Mapzen API for geographic search and geocoding, isochrone calculation, and vector data to draw map tiles. Look here for examples.
spelling v1.0: Provides spell checking for common document formats including latex, markdown, manual pages, and description files.
splashr v0.4.0: Provides tools to work with the Splash JavaScript Rendering and Scraping Service. There is an Introduction and vignettes on Helper Functions and Working with the splashrDSL.
writexl v0.2: Implements a portable, light-weight data-frame-to-xlsx exporter based on libxlsxwriter. No ‘Java’ or ‘Excel’ required.
Visualizations
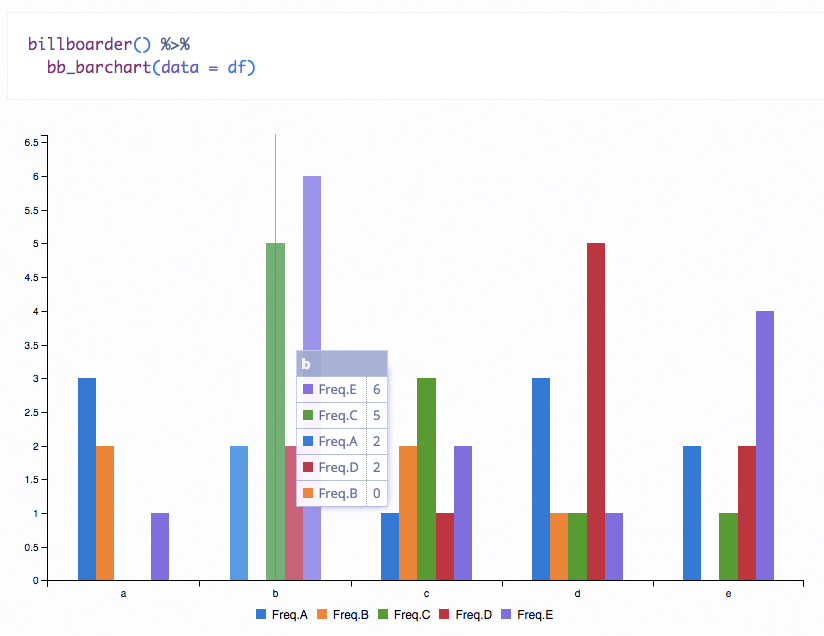
billboarder v0.0.3: Provides an htmlwidgets interface to billboard.js, a re-usable, easy interface to the JavaScript chart library, based on D3 v4+. Chart types include line charts, scatter plots, bar charts, pie/donut charts, and gauge charts. There is an Introduction and a vignette on Options for Styling Charts.
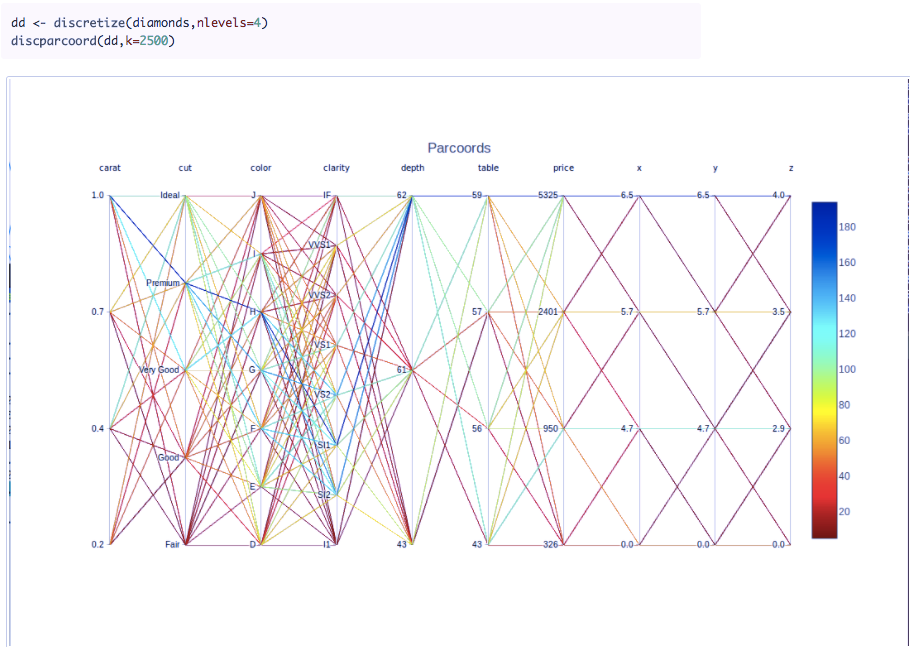
cdparcoord v1.0.0: Provides functions for plotting parallel coordinates with resolutions for large data sets and missing values. The vignette offers several examples.
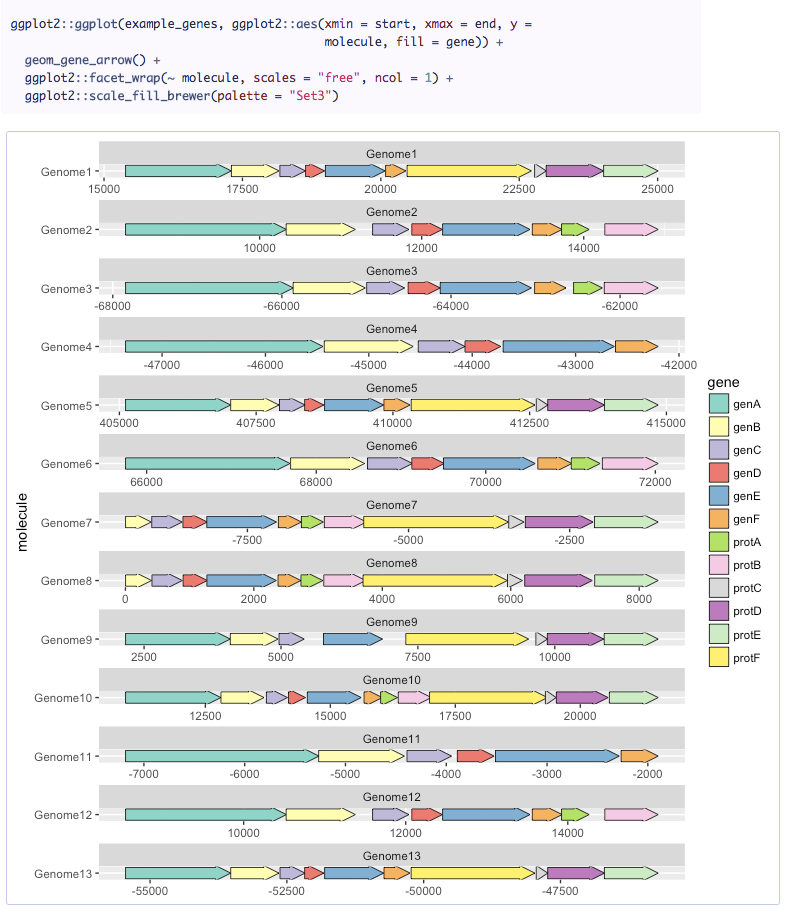
gggenes v0.2.0: Provides a ggplot2 geom and helper functions for drawing gene arrow maps.
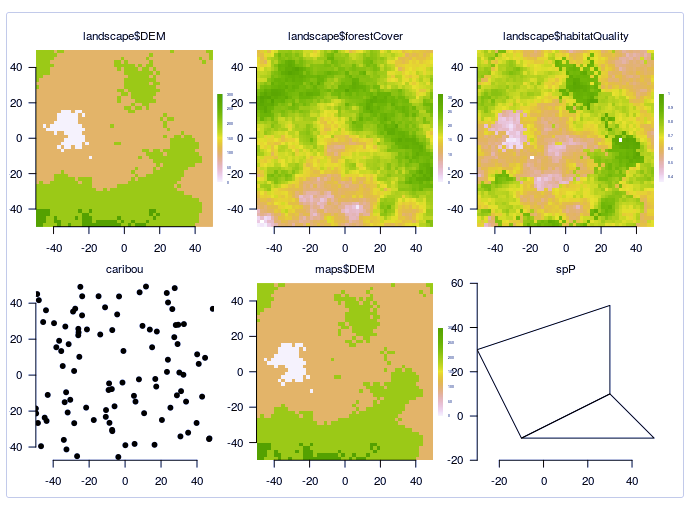
quickplot v0.1.1: Offers a high-level plotting system, built using ‘grid’ graphics, which is optimized for speed and modularity. The vignette provides examples.
treemapify v2.3.2: Provides ggplot2 geoms for drawing treemaps. There is a vignette with examples.
You may leave a comment below or discuss the post in the forum community.rstudio.com.