Hadrien Dykiel is an RStudio Customer Success Engineer
Microsoft PowerPoint is often the de facto choice for creating presentation slides, especially at larger companies. In many organizations, it comes pre-installed on workstations and pretty much everybody knows how to use it. This can make it an effective medium for sharing information, since most folks are comfortable with it. Unfortunately, valuable time is often lost manually creating slides. R developers often find themselves copying and pasting their results into presentation decks. Moreover, results may change or over time, requiring analysts and data scientists to manually update their slides with the latest results. So, in addition to being a time-consuming task, copying and pasting also introduces a big reproducibility problem. R can help solve these problems by programmatically exporting your results to PowerPoint for you.
Let’s say you are collaborating on a project in which members of your team will use other tools like SAS and Excel to perform their analyses. At the end of the day, you plan to combine all of your work together into a single presentation deck that will be shared with various business stakeholders. You boot up RStudio and open an R Markdown file and produce a correlation plot for the presentation.
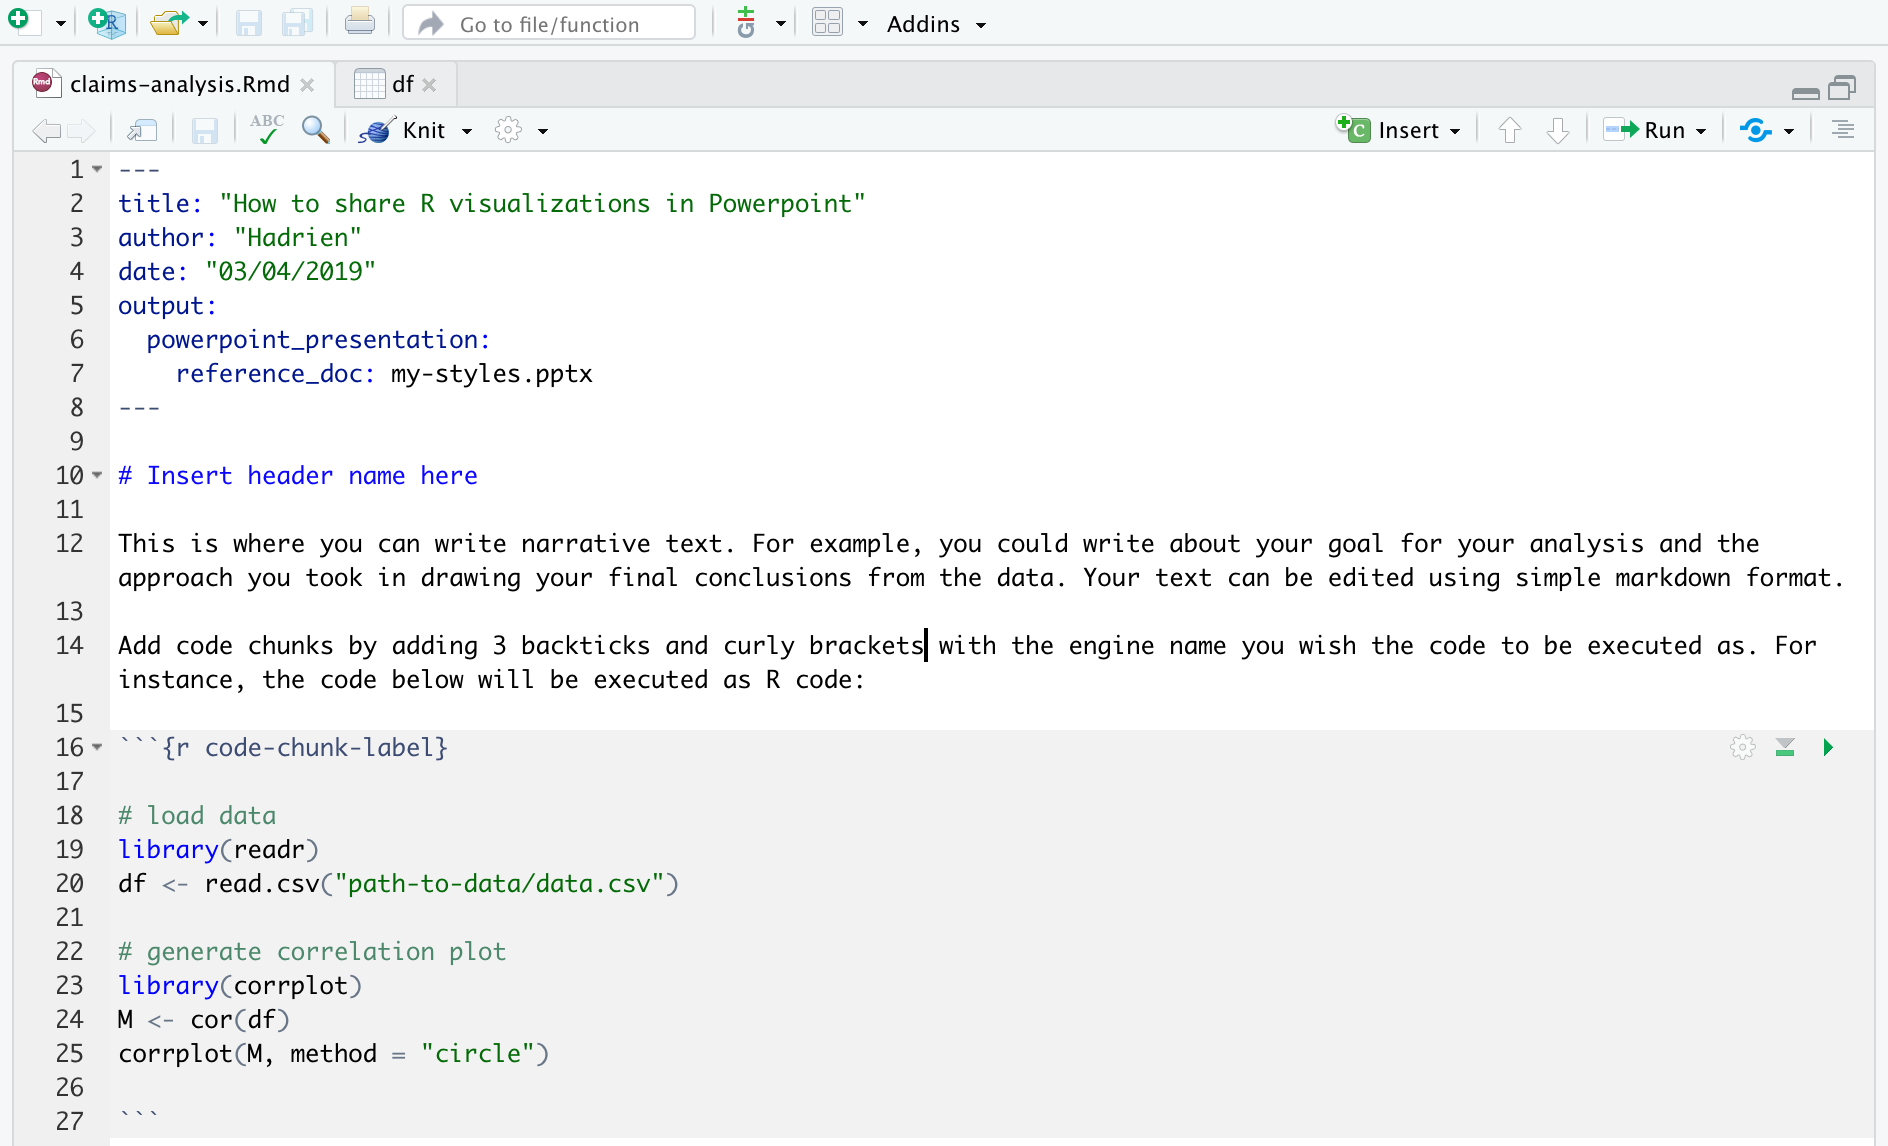
Rather than manually copying and pasting your corrplot into the final PowerPoint deck, you can update the output document type in your document’s YAML header to powerpoint_presentation. Optionally, you may also want to customize the appearance of your slides by passing a custom reference document via the reference_doc option. This is a nice option to use if you want your slides to match your company’s color schemes, for example. The snippet below shows what the code for a typical rmarkdown file with the output format set to PowerPoint might look like. Like all .Rmd files, it contains three elements: a YAML header that contains the metadata for your RMD file, narrative in simple markdown syntax, and code.
As soon as you hit the Knit button (or use the keyboard shortcut Cmd/Ctrl + Shift + K), RStudio initiates the knitting process. The rmarkdown package transforms your R script into markdown, and the pandoc package converts it to the PowerPoint output format, as specified in your YAML header. This process happens all underneath the hood, so as a user, the only thing you see is the final PowerPoint output file, which automatically opens as soon as your document finishes knitting. Because you created your PowerPoint slides programmatically, you can easily update them in the future, such as if new data becomes available and you wish to refresh your results.
The rmarkdown package offers a fair amount of flexibility for customizing your PowerPoint slides, such as having the ability to include R code, images, R visualizations, speaker notes, and customized column layout.
To learn more about creating PowerPoint presentations with R, Yihui’s RMD: The Definitive Guide and RStudio’s article Rendering Powerpoint Presentations with RStudio are both great resources.
You may leave a comment below or discuss the post in the forum community.rstudio.com.