Two hundred thirty new packages made it to CRAN in January. Here are my “Top 40” selections in ten categories: Data, Finance, Genomics, Machine Learning, Medicine, Science, Statistics, Time Series, Utilities, and Visualization.
Data
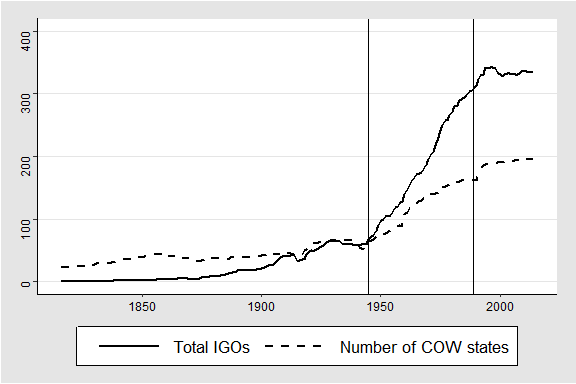
igoR v0.1.1: Provides tools to extract information from the Intergovernmental Organizations (‘IGO’) Database , version 3, provided by the Correlates of War Project. See Pevehouse et al. (2020) for information from 1815 to 2014, and get started with the vignette.
OTrecord v0.1.0: Uses optimal transportation theory as described in Gares, Guernec & Savy (2019) and Gares & Omer (2020) to solve recoding problems. Given two databases that share a subset of variables, package functions assist users in obtaining a unique synthetic database with complete information. See the vignette for examples.
pwt10 v10.0-0: Interfaces to the Penn World Table 10.x which provides information on relative levels of income, output, input, and productivity for 183 countries between 1950 and 2019.
trainR v0.0.1: Interfaces to the the National Rail Enquiries systems, including Darwin which provides real-time arrival and departure predictions, platform numbers, delay estimates, schedule changes and cancellations. Look here for examples.
Finance
LSMRealOptions v0.1.0: Provides an implementation of the least-squares Monte Carlo simulation method to value American option products and capital investment projects through real options analysis. Cash flows are modeled as being dependent upon underlying state variables that evolve stochastically. See the vignette for examples.
Genomics
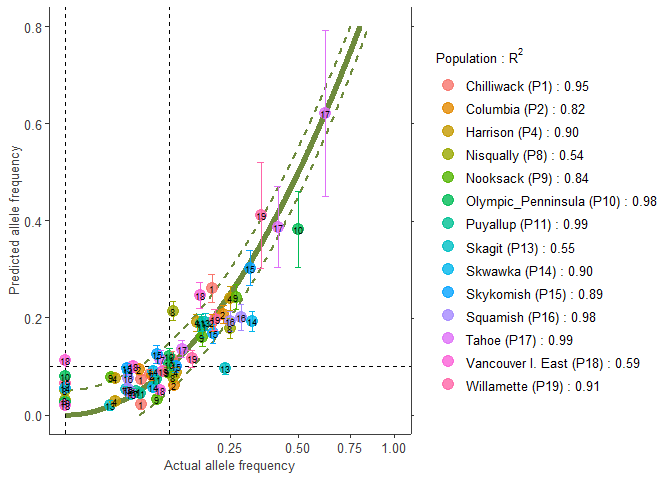
AlleleShift v0.9-2: Provides methods for calibrating and predicting shifts in allele frequencies through redundancy analysis (vegan::rda()) and generalized additive models (mgcv::gam()) and functions to visualize the predicted changes in frequencies. See README for examples.
GenomeAdmixR v1.1.3: Provides tools to simulate how patterns in ancestry along the genome change after admixture. Se Janzen (2020) for the details and the vignettes Isofemales, Joyplot, Visualization, and Walkthrough.

MOSS v0.1.0: Implements an omics integration method based on sparse singular value decomposition to deal with the challenges of high dimensionality, noise and heterogeneity among samples and features in omics data. See (Gonzalez-Reymundez & Vazquez, 2020) for background and the vignette for examples.
Machine Learning
autoMrP v0.98: Implements a tool that improves the prediction performance of multilevel regression with post-stratification (MrP) by combining a number of machine learning methods. For information on the method, refer to Broniecki, Wüest, Leemann (2020) and the vignette.
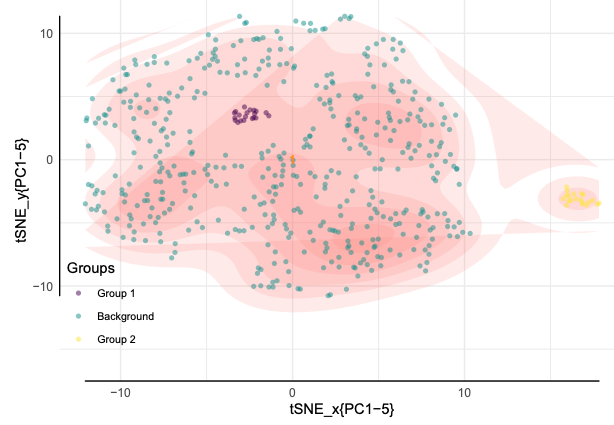
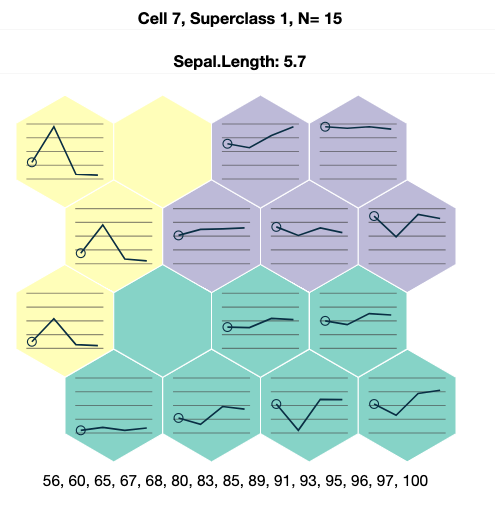
aweSOM v1.1: Implements Self-organizing maps, a method for dimensionality reduction and clustering of continuous data, as well as interactive graphics to assist analysis. See Kohonen (2001) for background and the vignette for an overview of the package.
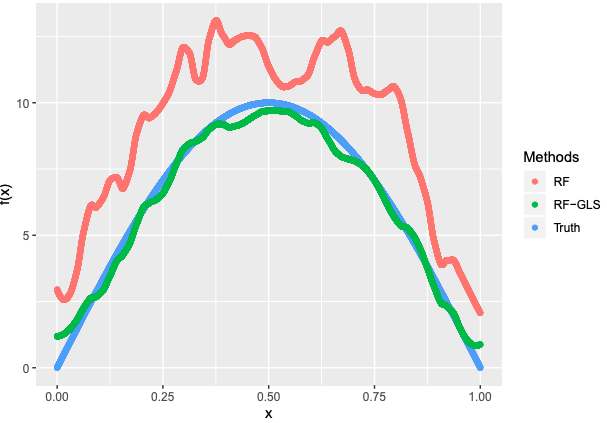
RandomForestsGLS v0.1.2: Fits non-linear generalized least square regression models with Random Forests as described in Saha, Basu & Datta (2020).
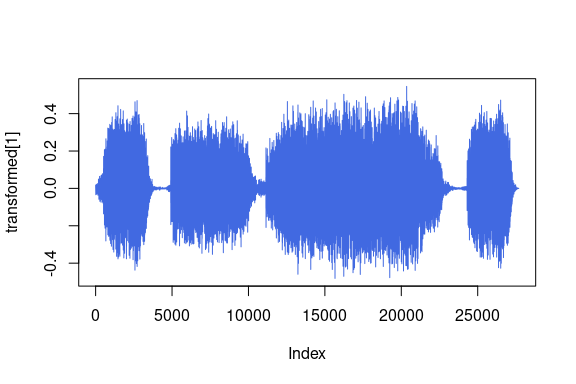
torchaudio v0.1.1.0: Provides access to datasets, models and preprocessing facilities for deep learning in audio. See the vignette.
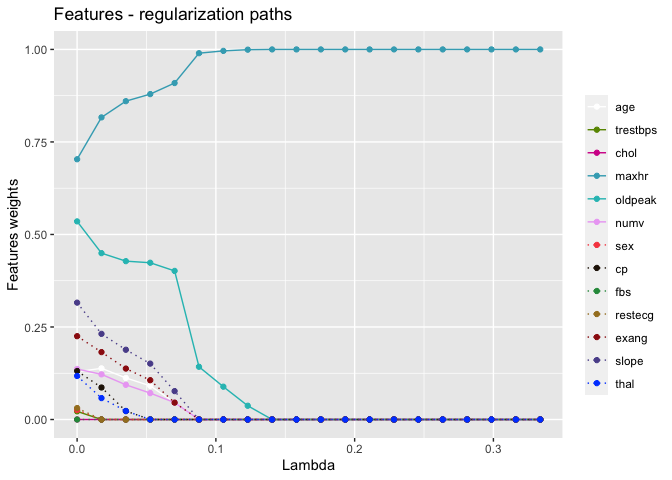
vimpclust v0.1.0: Implements functions to perform sparse k-means clustering with a group penalty and variable selection on mixed categorical and numeric data. See Chavet et al. (2020) for background. There are vignettes on numeric and mixed data sparse k-means clustering.
Medicine
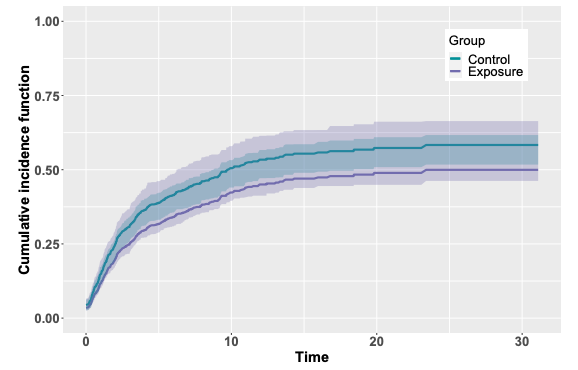
cmprskcoxmsm v0.2.0: Provides functions to estimate treatment effect a under marginal structure model for the cause-specific hazard of competing risk events. Functions also estimate the risk of the potential outcomes, risk difference and risk ratio. See Hernan et al. (2001) for the theory and the vignette for examples.
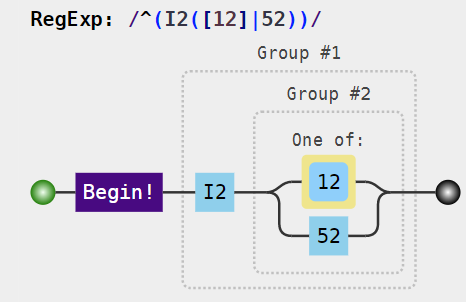
coder v0.13.5: Provides functions to classify individuals or items based on external code data identified by regular expressions. A typical use case considers patients with medically coded data, such as codes from the International Classification of Diseases. There is an overview and vignettes on class codes, interpreting regular expressions, and example data.
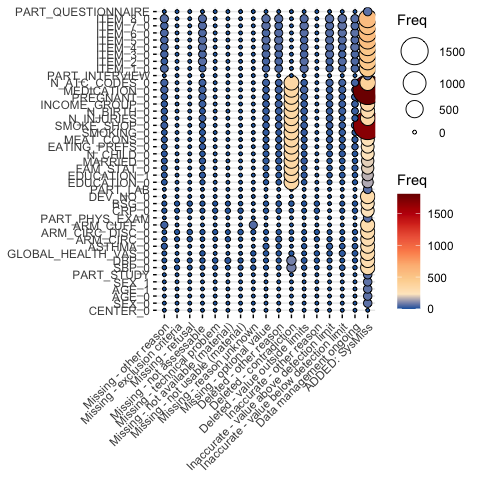
dataQuieR v1.0.4: Provides functions to assess data quality issues in studies. See the TMF Guideline and the DFG Project for background, and the vignette for examples.
NHSDataDictionaRy v1.2.1: Provides a common set of simplified web scraping tools for working with the NHS Data Dictionary.This package was commissioned by the NHS-R community to provide this consistency of lookups. See the vignette to get started.
Science
LPDynR v1.0.1: Implements methods that use phenological and productivity-related variables derived from time series of vegetation indexes to assess ecosystem dynamics. Functions compute an indicator with five classes of land productivity dynamics. Look here for background. See the vignette for an example.
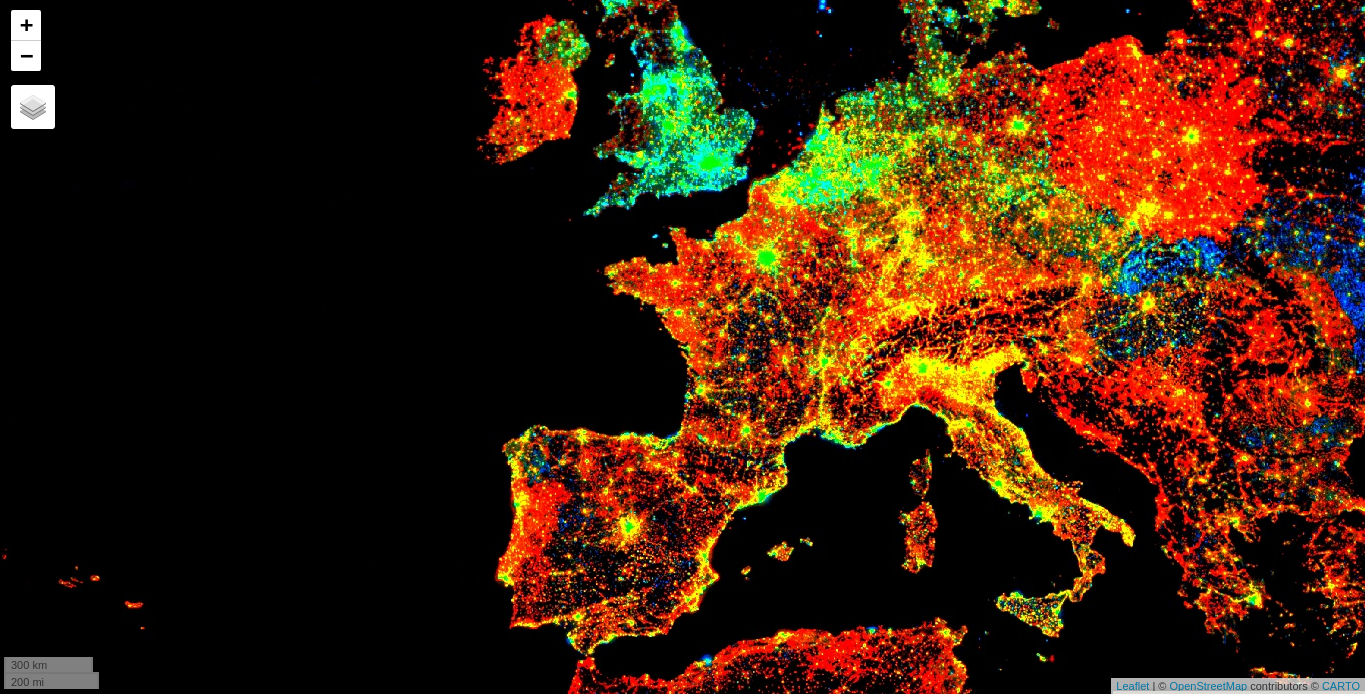
rgee v1.0.8: Provides an Earth Engine client library for R that includes all Earth Engine API classes, modules, and functions, as well as additional functions for importing spatial objects, extracting time series, and displaying metadata and interactive maps. Look here for further details. Read the Introduction and the vignette on Best Practices to get started.
SAMtool v1.1.1: Provides tools for simulating the MSEtool operating model to inform data-rich fisheries. It includes a conditioning model, tools for assessing models of varying complexity and comparing models, and diagnostic tools for evaluating assessments inside closed-loop simulations. There is a User Guide and a series of seven more vignettes including an overview of the Rapid Conditioning Model (RCM) for conditioning MSEtool operating models, and a mathematical description of RCM.
Statistics
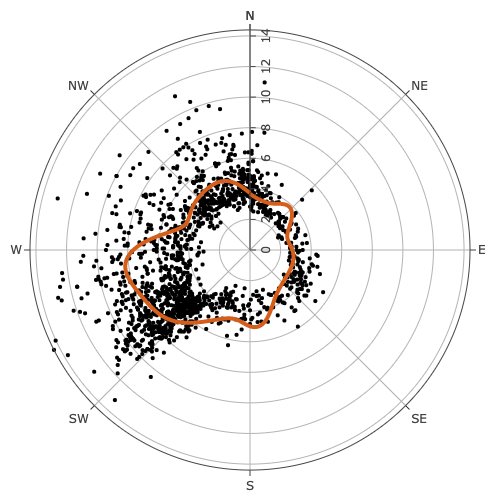
circularEV v0.1.0: Provides functions for performing extreme value analysis on a circular domain. See the local methods example and the spline example.
ghcm v1.0.0: Implements a statistical hypothesis test for conditional independence which can be applied to both discretely observed functional data and multivariate data. See Lundborg et al. (2020) for details and the vignette for an overview of the generalized Hilbert Covariance measure with examples.
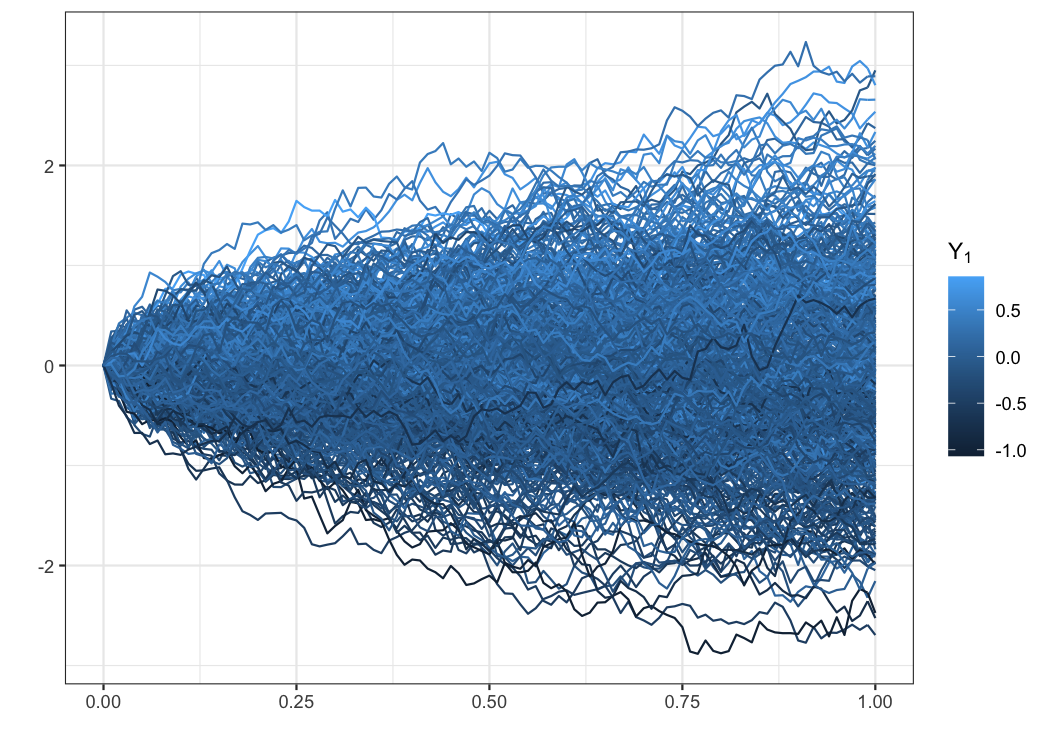
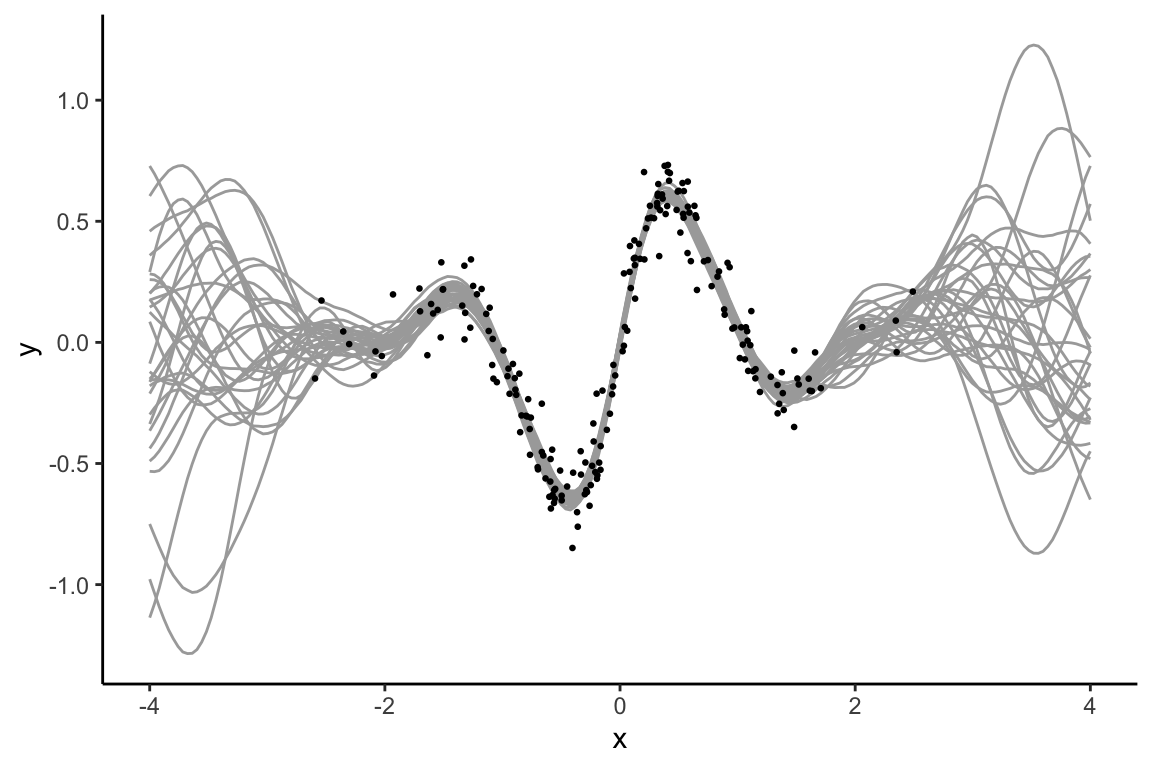
gplite v0.11.1: Implements the most common Gaussian process models using Laplace and expectation propagation approximations, maximum marginal likelihood inference for the hyperparameters, and sparse approximations for larger datasets. See the vignette for a quick start.
multibridge v1.0.0: Implements functions to evaluate hypotheses concerning the distribution of multinomial proportions using bridge sampling. Functions are able to compute Bayes factors for hypotheses that entail inequality constraints, equality constraints, free parameters, and mixtures of all three. See Sarafoglou et al. (2020) for background and the examples: Memory of Lifestresses, Mendelian Laws of Inheritance, and Prevalence of Statistical Reporting Errors.
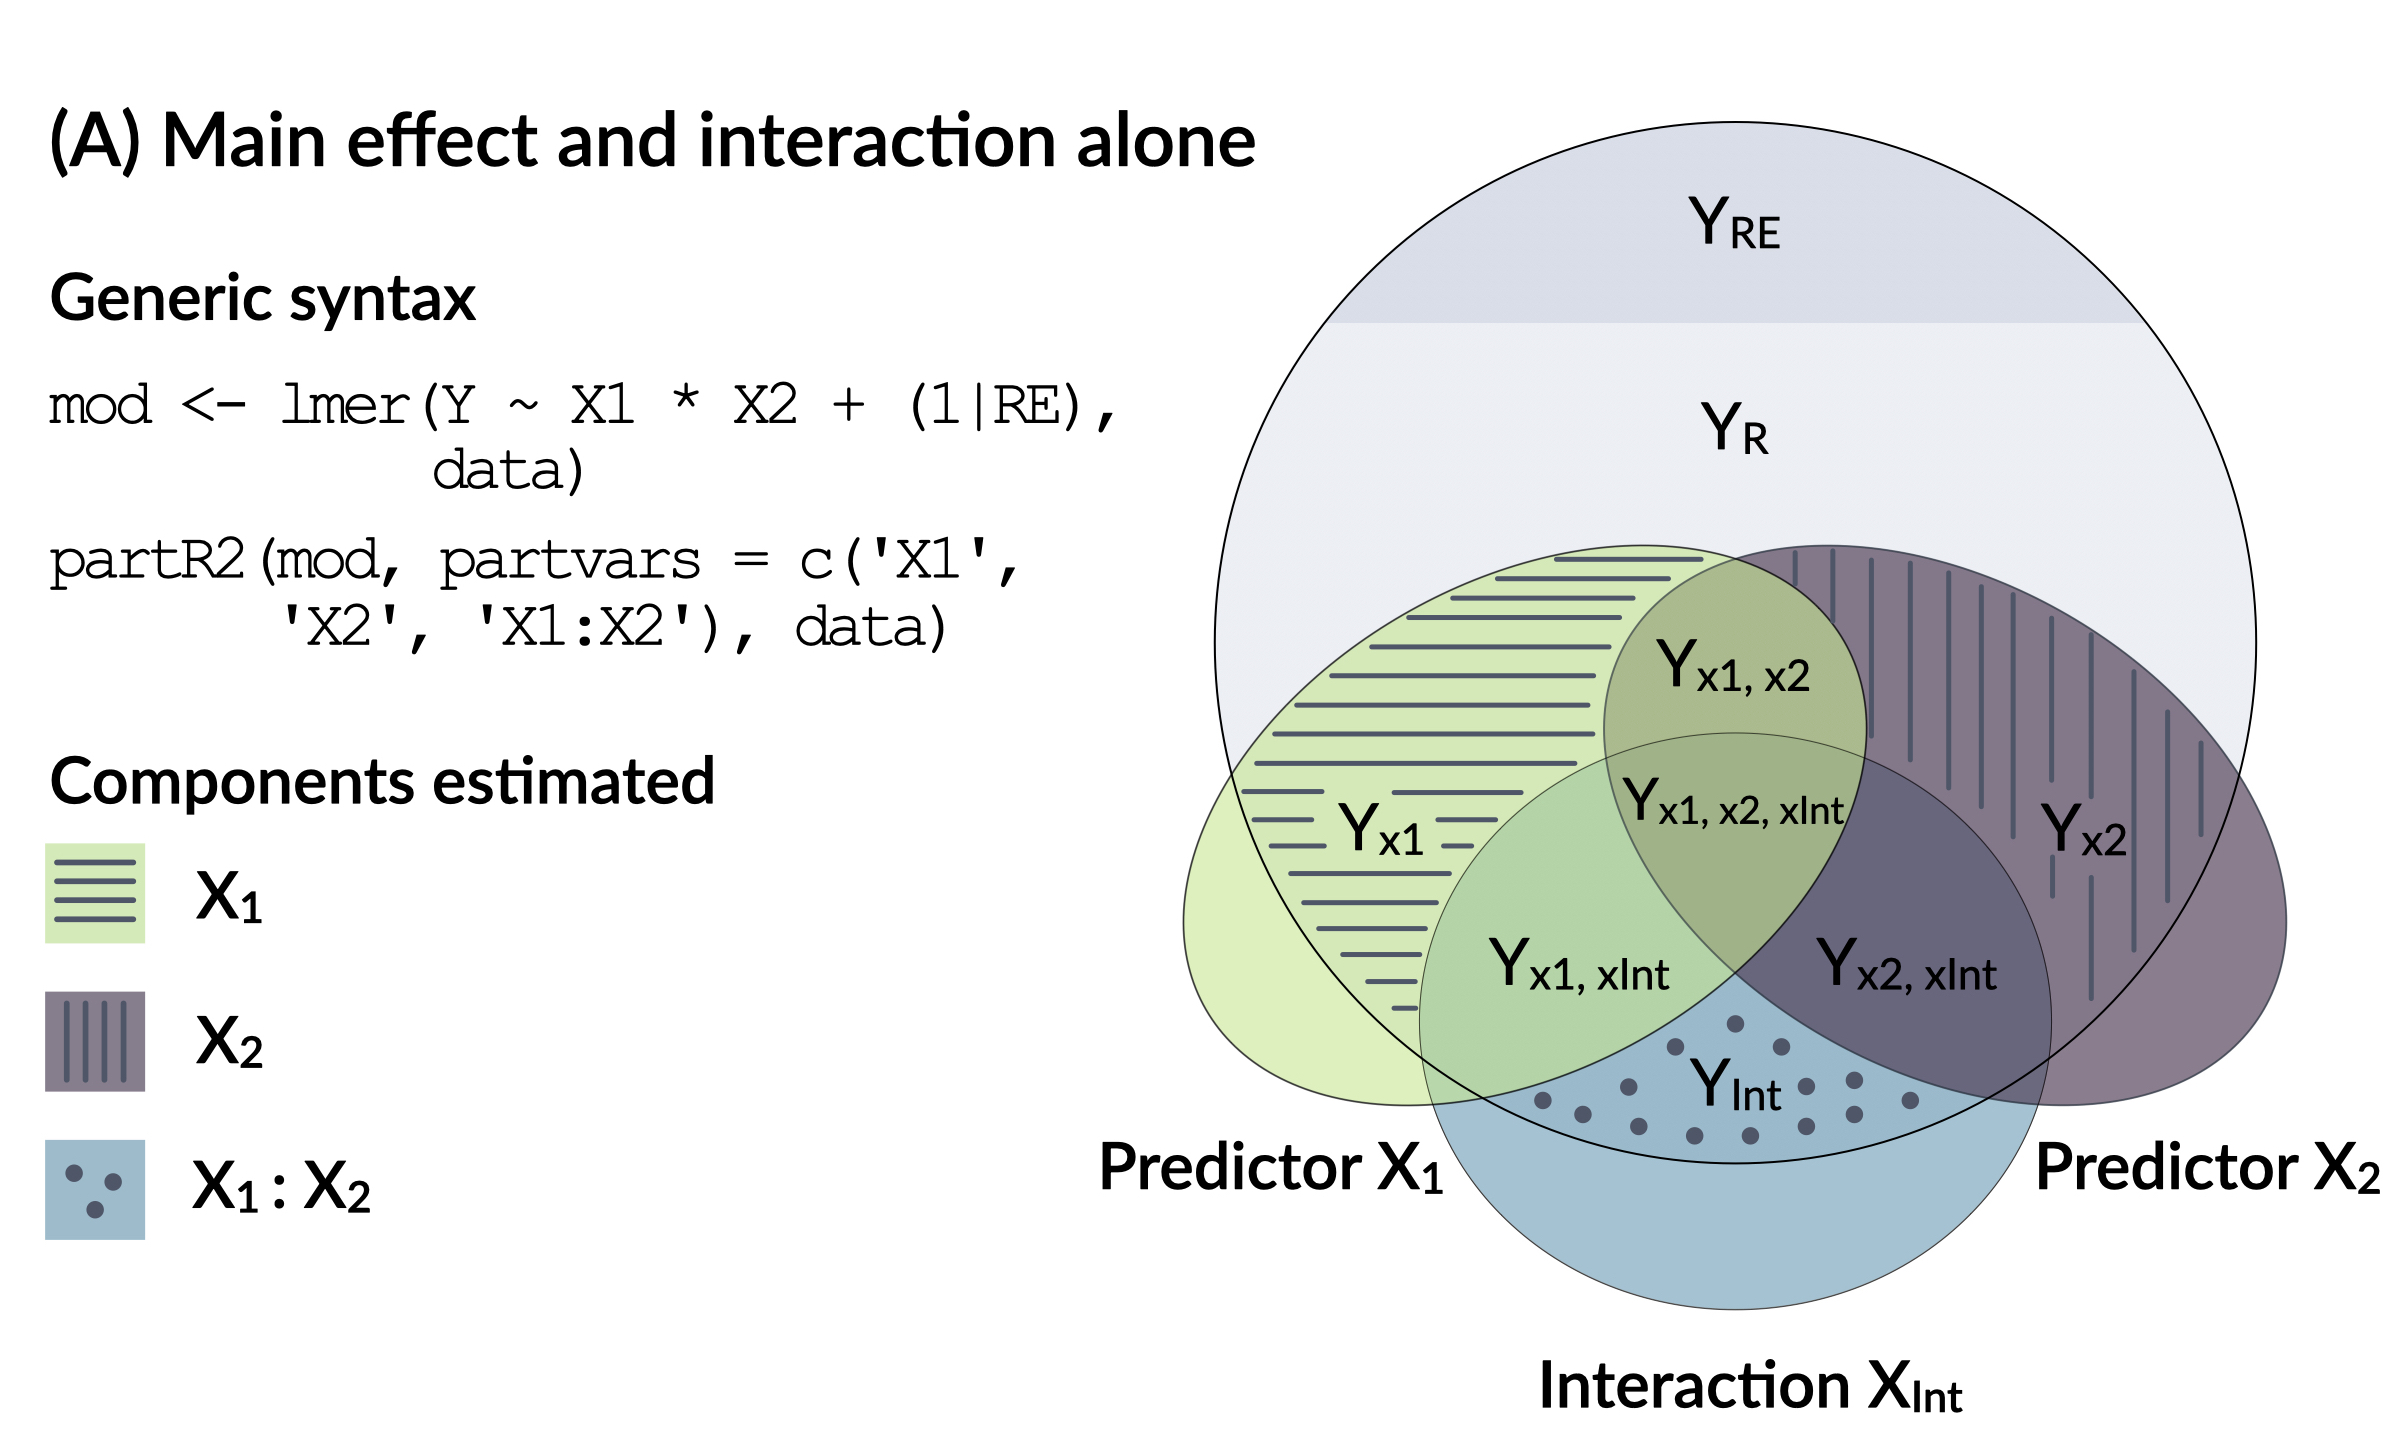
partR2 v0.9.1: Provides functions to to partition the variance explained in generalized linear mixed models (GLMMs) into variation unique to predicators and variation shared among predictors. This can be done using semi-partial R2 and inclusive R2. See Nakagawa & Schielzeth (2013) and Nakagawa, Johnson & Schielzeth (2017) for the theory and the vignette for examples.
spNetwork v0.1.1: Provides tools to perform spatial analysis on network including estimating network kernel density, building spatial matrices. See Okabe et al. (2019) for background and the vignettes: Network k Functions, Network Kernel Density Estimate, Details about NKDE, and Spatial Weight Matrices.

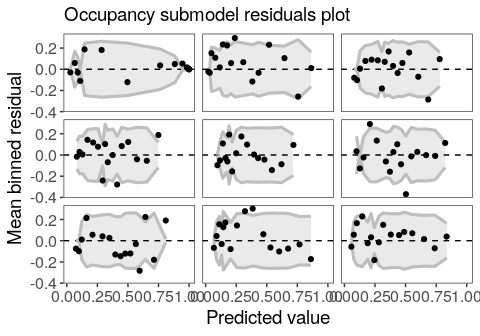
ubms v1.0.2: Provides functions to fit Bayesian hierarchical models, including single-season occupancy, dynamic occupancy, and N-mixture abundance models, of animal abundance and occurrence with the rstan package. See Carpenter et al. (2017) and Fiske and Chandler (2011) for background. There is a package Overview, a vignette on Random Effects, and another on Comparing ubms with JAGS.
Time Series
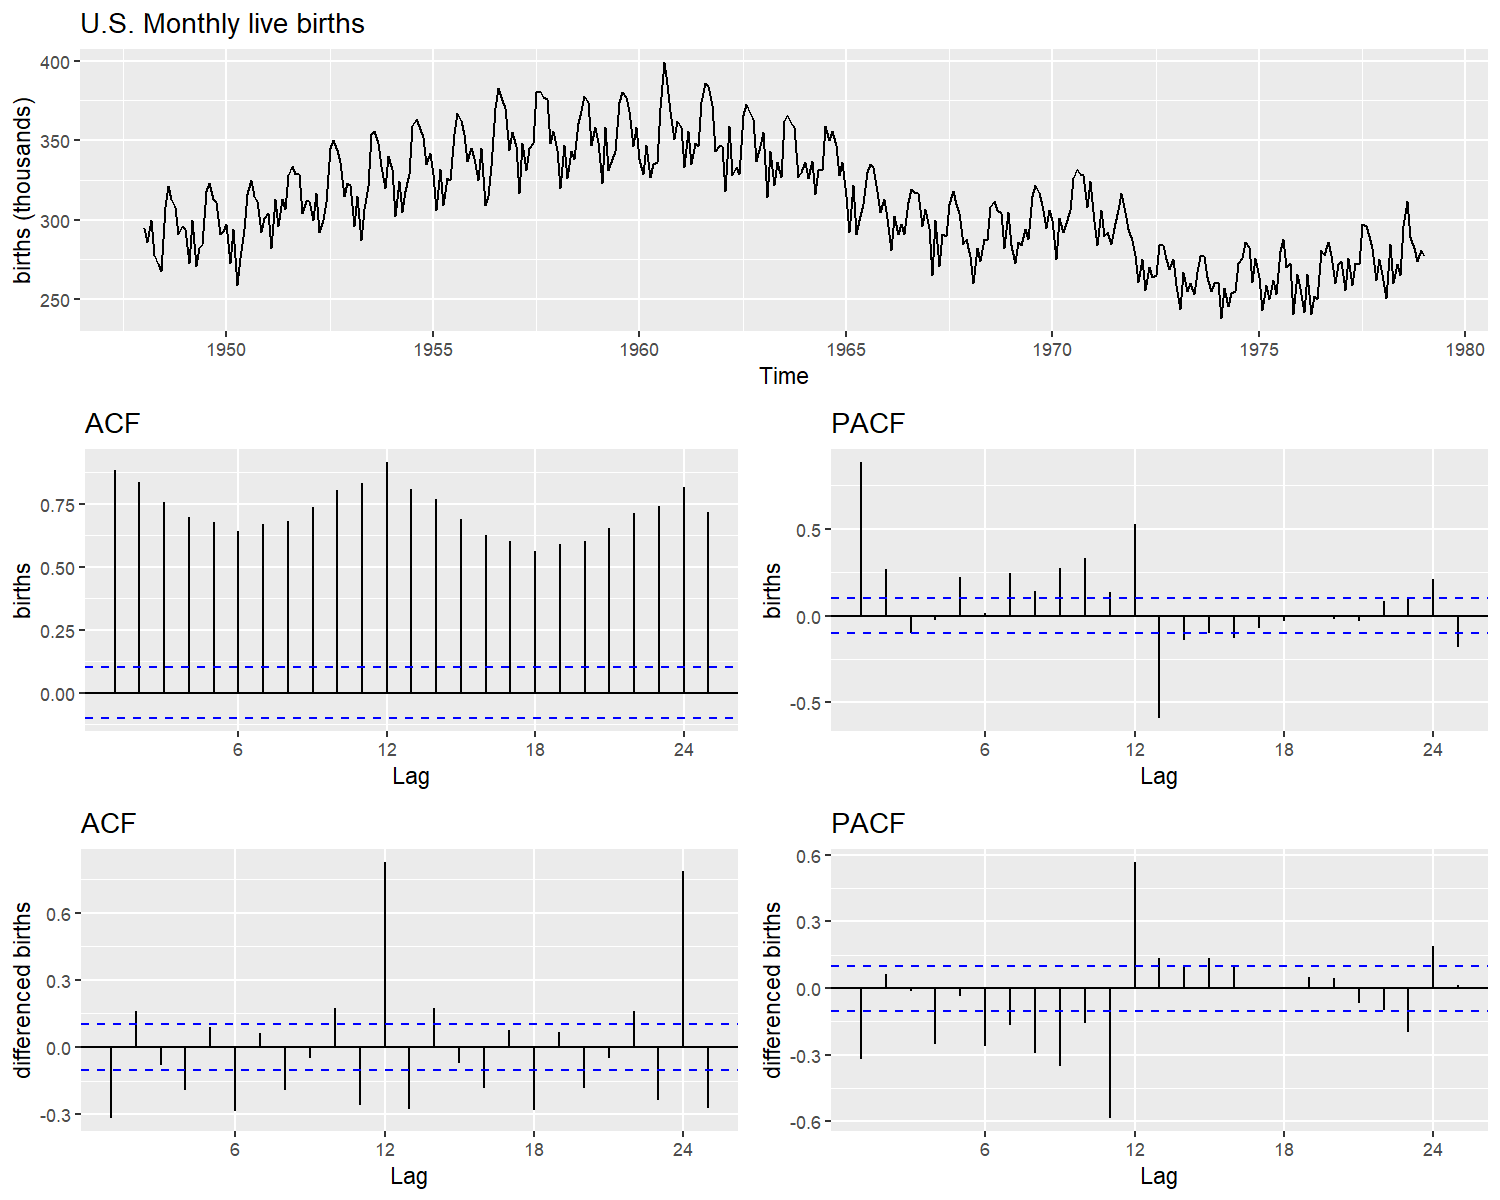
autostsm v1.2: Provides functions to automate the decomposition of structural time series into trend, cycle, and seasonal components using the Kalman filter. See Koopman et al. (2012) for the theory and the vignette for an overview with examples.
bayesforecast v0.0.1: Provides functions to fit Bayesian time series models using Stan for full Bayesian inference. It includes seasonal ARIMA, ARIMAX, dynamic harmonic regression, GARCH, t-student innovation GARCH models, asymmetric GARCH, random walks, stochastic volatility models for univariate time series. See Hyndman (2017) and Carpenter et al. (2017) for background and README for examples.
Utilities
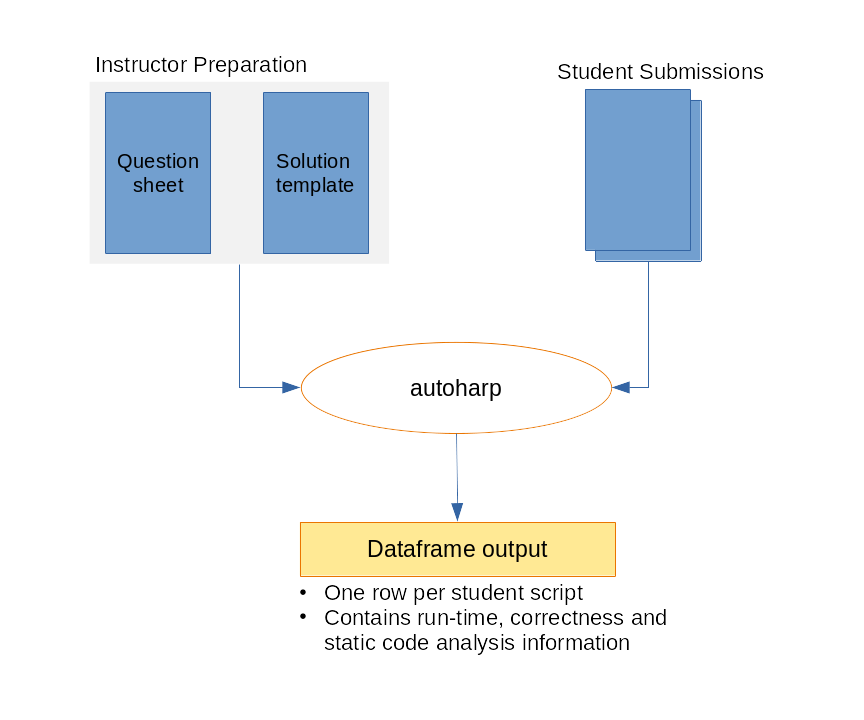
autoharp v0.0.5: Implements customizable tools for assessing and grading R or R-markdown scripts from students which allow for checking correctness of code output, runtime statistics and static code analysis. There is a User Manual and a vignettes on the S4 class treeharp.
cachem v1.0.4: Provides functions to cache R objects with automated pruning. Caches can limit either their total size or the age of the oldest object (or both), automatically pruning objects to maintain the constraints. See README for examples.
eList v0.2.0: Provides list compression functions to convert for loops into vectorized lapply() functions which support loops with multiple variables, parallelization, and loops across non-standard objects. See the vignette for examples.
Microsoft365R v1.0.0: Builds on AzureGraph to implement and interface to Microsoft365 and enables access to data stored in SharePoint Online and OneDrive. See the vignette to get started.
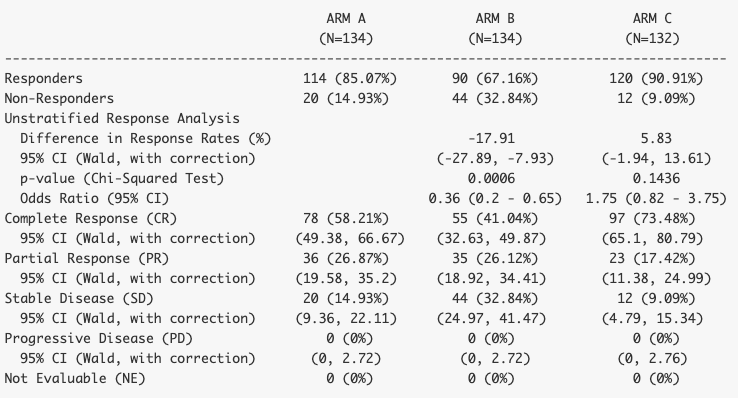
rtables v0.3.6: Provides a framework for declaring complex multi-level tabulations and then applying them to data. Tables are modeled as hierarchical, tree-like objects which support sibling sub-tables, arbitrary splitting or grouping of data in row and column dimensions, cells containing multiple values, and the concept of contextual summary computations. There is a Introduction and a series of vignettes on comparing against baseline or control, a clinical trials example, constructing tables manually, pruning and sorting tables, subsetting tables, Tabulation concepts, and a comparison with dplyr tabulation.
targets v0.1.0: Brings together function-oriented programming and make- like declarative workflows in toolkit for building statistics and data science pipelines in R. The methodology borrows from GNU make and drake. See the vignette and the reference website.
Visualization
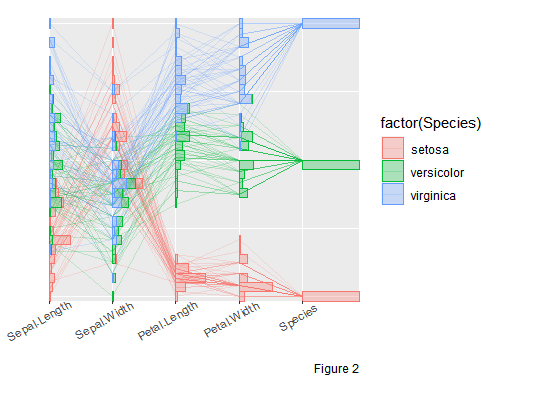
ggmulti v0.1.0: Provides tools such as serial axes objects, Andrew’s plot, various scatter plot glyphs to visualize high dimensional data. There are vignettes on visualizing high dimensional data, adding glyphs to scatter plots, and creating histograms with density.
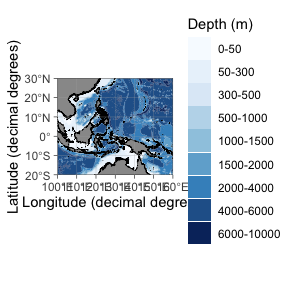
ggOceanMaps v1.0.9: Allows plotting data on bathymetric maps using ggplot2 using data that contain geographic information from anywhere around the globe. There is a User Manual and a vignette on pre-made shape files.
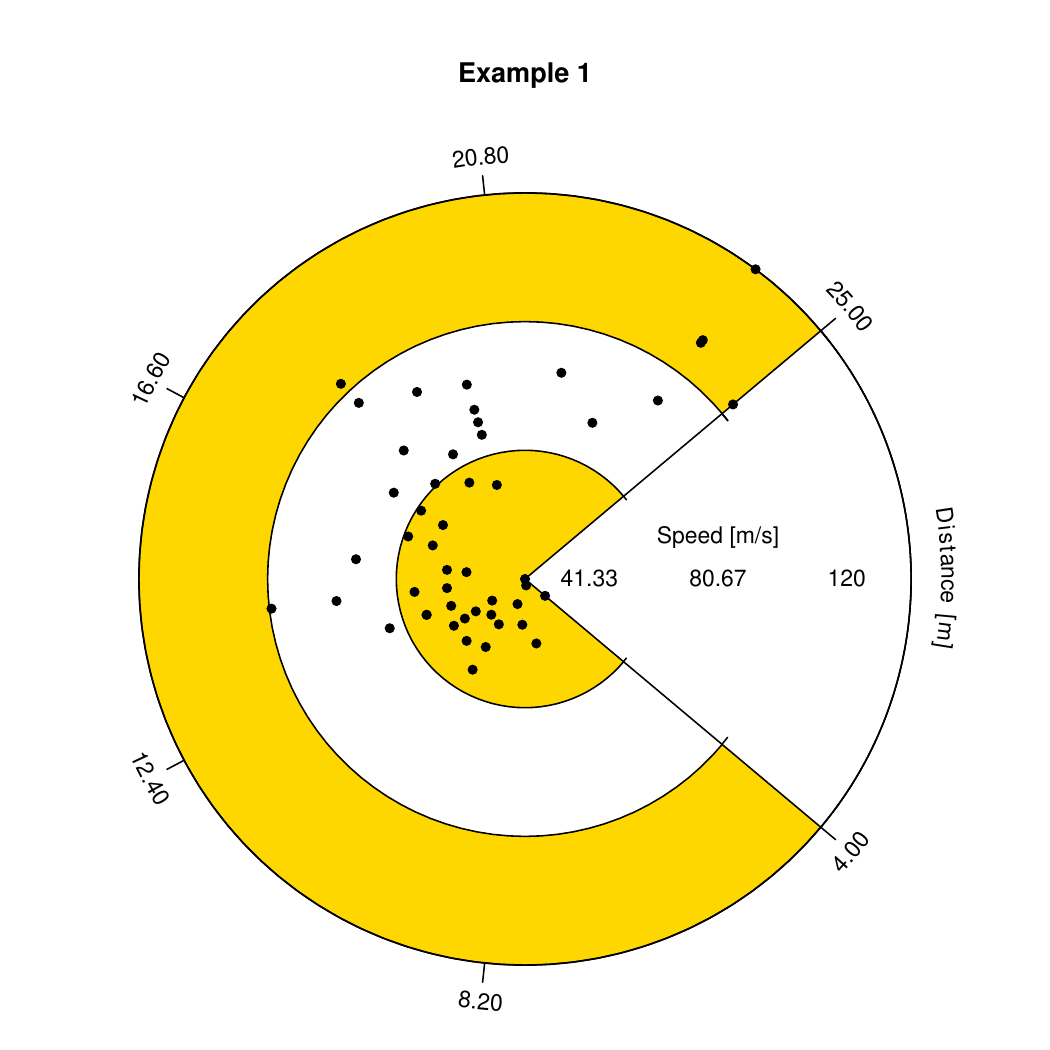
pacviz v1.0.0.5: Provides functions to map data onto a radial coordinate system and visualize the residual values of linear regression and Cartesian data in the defined radial scheme. See the pacviz documentation for more information.
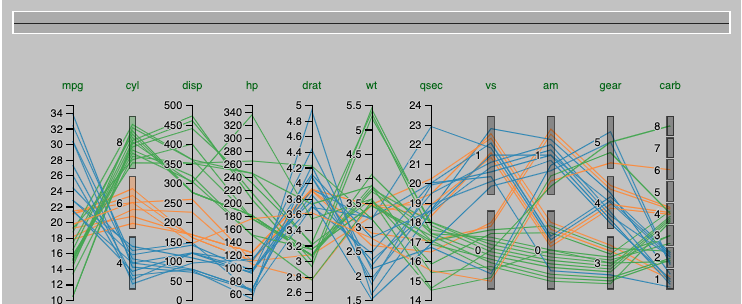
parallelPlot v0.1.0: Provides functions to create parallel coordinates plots using the htmlwidgets package and d3.js. The vignette provides multiple examples.
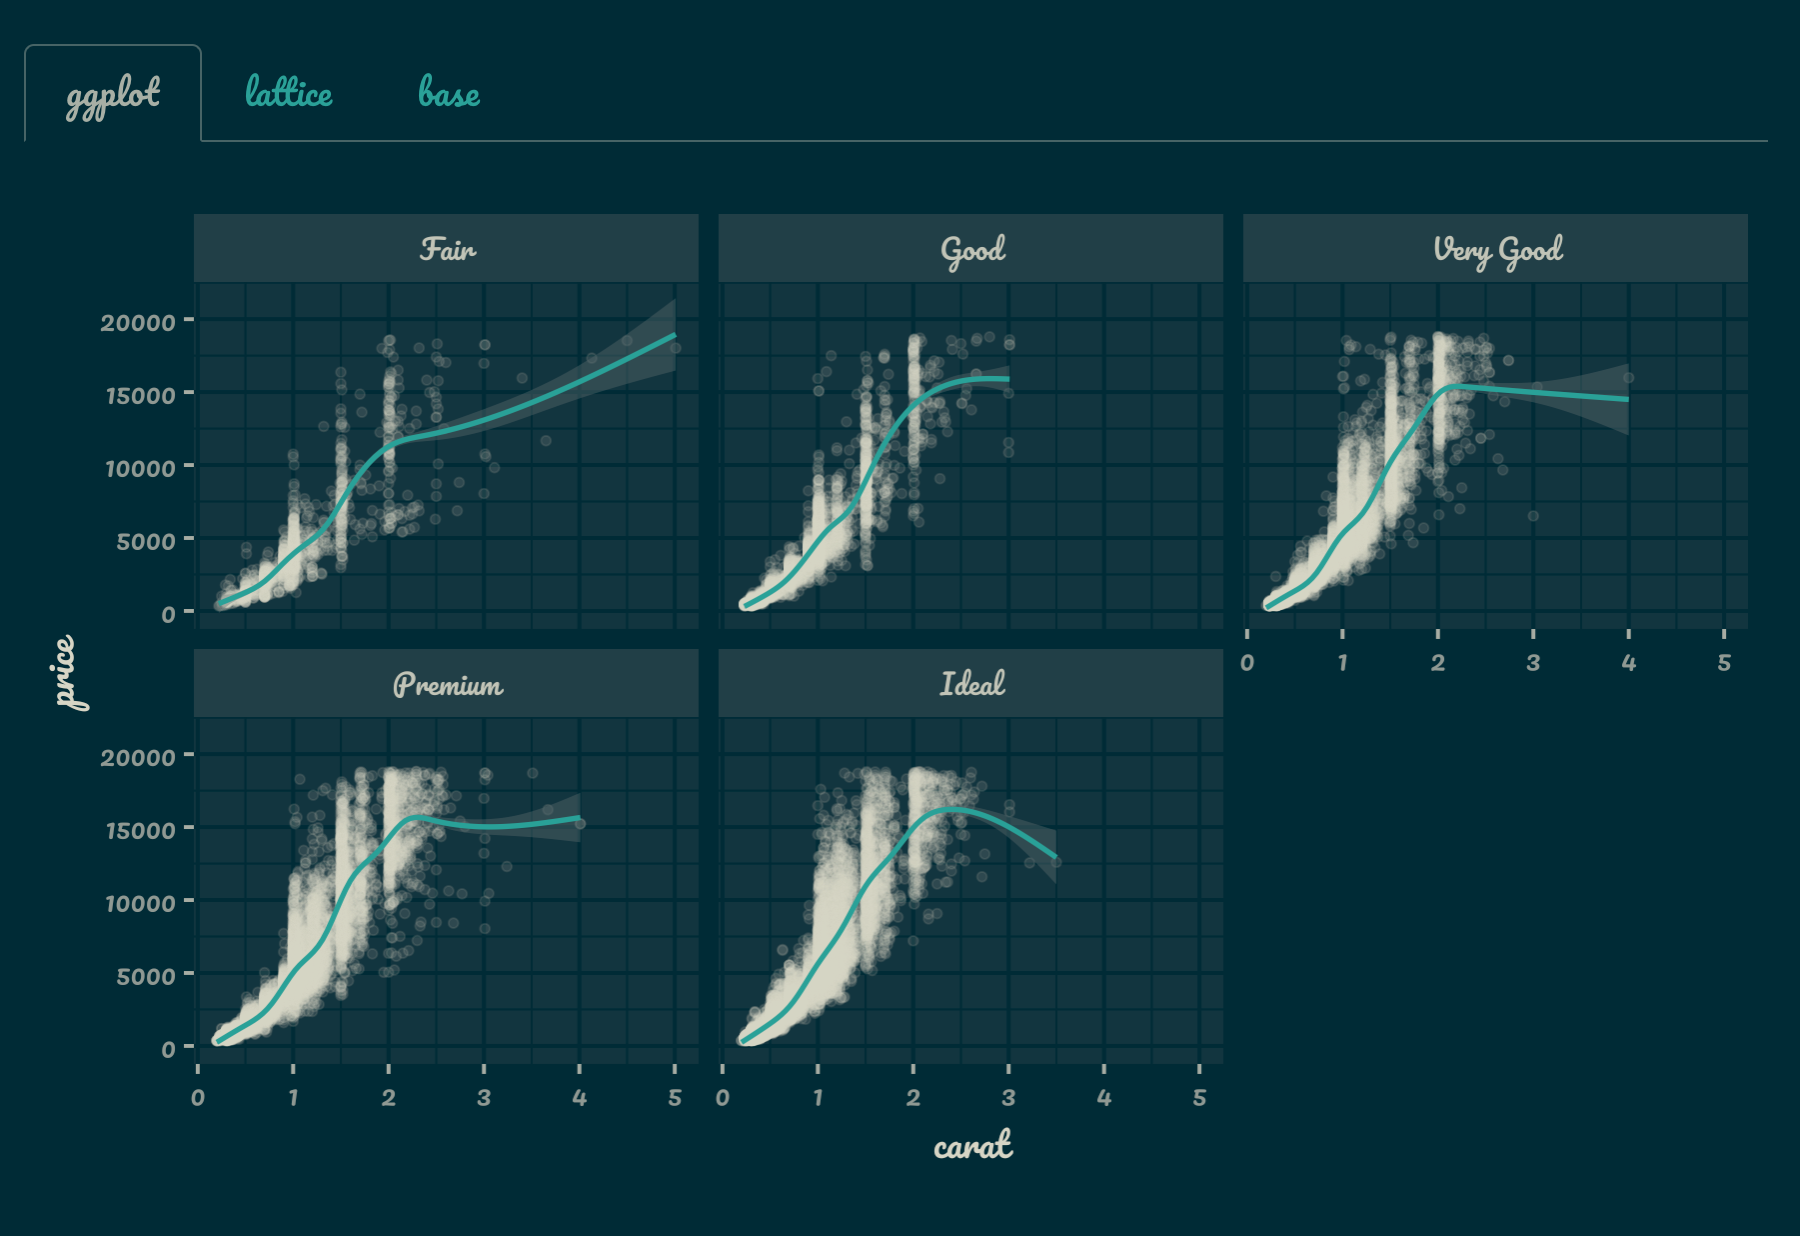
thematic v0.1.1: Provides tools to “theme” ggplot2, lattice, and base graphics using a small set of choices that include foreground color, background color, accent color, and font family. See README for examples.
You may leave a comment below or discuss the post in the forum community.rstudio.com.