One hundred eighty-three new packages stuck to CRAN in July. Here are my “Top 40” picks in eleven categories: Data, Ecology, Finance, Genomics, Machine Learning, Medicine, Science, Statistics, Time Series, Utilities, and Visualization. Although I don’t have any formal specification for these categories, I do my best to main my subjective sense of consistency from month to month. Nevertheless, watching the monthly ebb and flow of the number of packages that fit into the various categories is interesting. This month, developers seemed to be focused on utilities. I classified forty-five packages as utilities this month.
Data
beans v0.1.0: Contains data on 13,611 beans from Koklu and Ozkan (2020). The beans have been quantified using 16 morphologic image features and labeled with one of 6 values.
geckor v0.1.1: Provides functions to collect current and historical cryptocurrency market data using the public CoinGecko API. There is a brief overview and vignettes on Current and Historical market data.
ISLR2 v1.0: Contains the data sets used in the book An Introduction to Statistical Learning with Applications in R, Second Edition.
sageR v0.3.0: Provides the data sets used in the book Statistiques pour l’économie et la gestion, Théorie et applications en entreprise. Look here for descriptions of the data with code and plots.
Ecology
DA v1.2.0: Provides functions for Discriminant Analysis (DA) for evolutionary inference, especially population genetic structure and community structure inference as described in Qin et al. (2020). See the Introduction.
Ostats v0.1.0: Provides functions to calculate O-statistics, or overlap statistics, which measure the degree of community-level trait overlap. See Read et al. (2018) for background. There is an Introduction and a vignette on Multivariate Ostats.
Finance
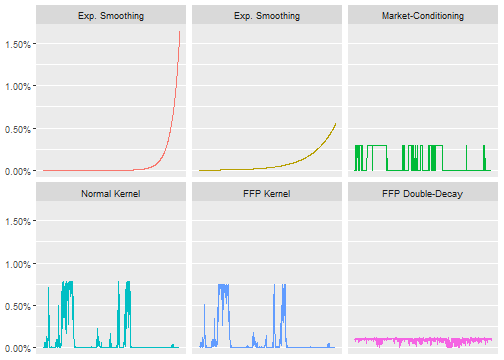
ffp v0.1.0: Implements numerical entropy-pooling for scenario analysis as described in Meucci (2010) See the vignette.
Genomics
utr.annotation v1.0.4: Implements a fast tool for annotating potential deleterious variants in the untranslated regions for both human and mouse species. See Liu & Dougherty (2021) for background and the vignette for and introduction and examples.
OmicNavigator v1.4.3: Provides a for interactive exploration of the results from ‘omics’ experiments to facilitate novel discoveries from high-throughput biology. There is a User’s Guide and a vignette on the package’s API.
Machine Learning
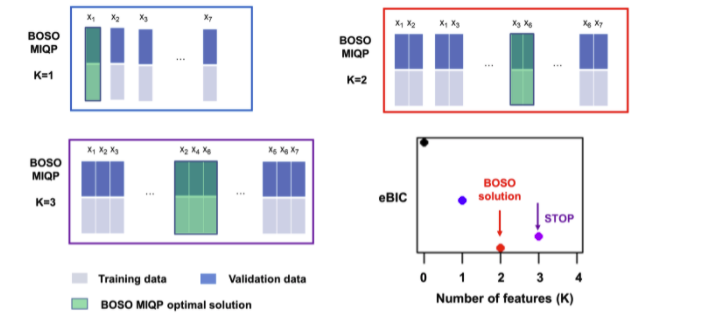
BOSO v1.0.3: Implements the BiLevel Optimization Selector Operator feature selection algorithm for linear regression as described in Valcarcel et al. (2020). See the vignette for examples.
FeatureTerminatoR v1.0.0: Implements a feature selection engine that removes features with minimal predictive power. See Boughaci (2018) for background and the vignette for and example.
hhcartr v1.0.0: Implements the HHCART-G algorithm described in Wickramarachchi et al. (2019). See the vignette.
recometrics v0.1.3: Implements evaluation metrics for implicit-feedback recommender systems based on low-rank matrix factorization models, given the fitted model matrices and data. See the vignette for examples.
tidylda v0.0.1: Implements an algorithm for Latent Dirichlet Allocation (LDA) as described in Blei et at. (2003) using tidyverse principles. See README for an overview.
Medicine
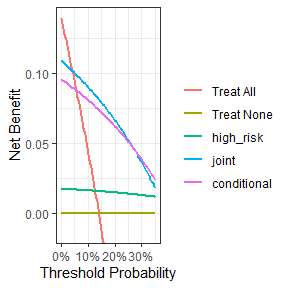
dcurves v0.2.0: Implements a decision curve analysis method for evaluating and comparing prediction models that incorporates clinical consequences and requires only the data set on which the models are tested. See Vickers (2006), Vickers (2008), and Pfeiffer (2020) for background, and the vignette for examples.
KHQ v0.2.0: Provides methods to calculate scores for each dimension of the The King’s Health Questionnaire (KHQ) ; converts KHQ item scores to KHQ5D scores; and also calculates the utility index of the KHQ5D. See the vignette.
Science
AvInertia v0.0.1: Provides functions to compute the center of gravity and moment of inertia tensor of any flying bird. See the vignette for some insight into bird design.
bayesnec v1.0.1: Provides functions to fit dose concentration response curves to toxicity data, and derive No-Effect-Concentration (NEC), No-Significant-Effect-Concentration (NSEC), and Effect-Concentration (of specified percentage ‘x’, ECx) thresholds from non-linear models fitted using Bayesian MCMC fitting methods via brms and Stan. There are vignettes on Single model usage, Multi model usage, Model details, Priors, and Comparing posterior predictions.
Statistics
itdr v1.0: Provides functions to estimate the sufficient dimension reduction subspaces, i.e., central mean subspace or central subspace in regression, using Fourier transformation proposed by Zhu & Zeng (2006), the convolution transformation proposed by Zeng & Zhu (2010), and an iterative Hessian transformation methods proposed by Cook & Li (2002). See the vignette for an example.
mlfit v0.5.2: Extends the [Iterative Proportional Fitting] (IPF) algorithm which operates on count data to nested structures with constraints. See Müller & Axhausen (2011) for background and look here for and example.
optimall v0.1.0: Provides functions for the survey sampling design process with specific tools for multi-wave and multi-phase designs. Users can perform optimum allocation according to Neyman (1934) or Wright (2012). There is a User’s Guide, there are vignettes Multiwave Object and Splitting Strata with Optimall Shiny.
posterior v1.0.1: Provides tools for both users and package developers for fitting and working with Bayesian models; including tools to: efficiently convert between different formats of draws from distributions, provide consistent methods for common operations, provide summaries in convenient formats, and implement state of the art posterior inference diagnostics. See Vehtari et al. (2021) for background. There is an Introduction and a vignette on the Random Variable Datatype.
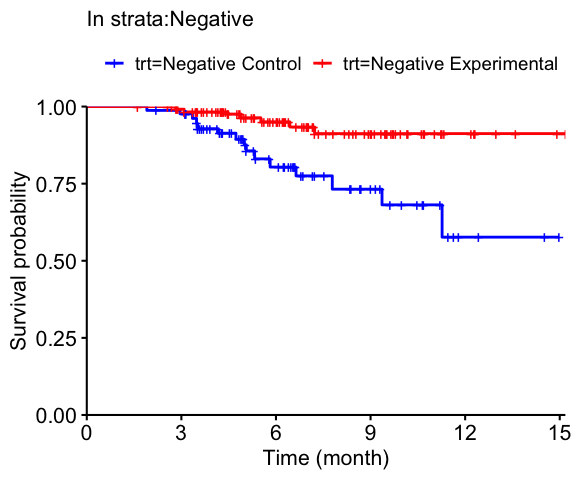
PropensitySub v0.2.0: Provides functions to estimate treatment effects in strata via inverse probability weighting or propensity score matching when subjects have missing strata labels. See the vignette for examples.
ReplicationSuccess v1.0.0: Provides utilities for the design and analysis of replication studies featuring both traditional methods based on statistical significance and more recent methods such as the skeptical p-value Held L. (2020), the harmonic mean chi-squared test Held, L. (2020), and intrinsic credibility Held, L. (2019). See the vignette for examples.
Time Series
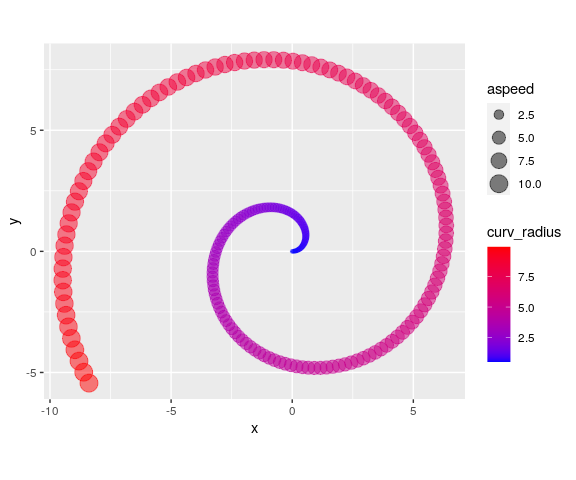
kinematics V1.0.0: Provides functions to analyze time series representing two-dimensional movements. It accepts a data frame with a time (t), horizontal (x) and vertical (y) coordinate as columns, and returns several dynamical properties such as speed, acceleration or curvature. See the vignette for examples.
profoc v0.8.3: Provides methods to combine probabilistic forecasts using CRPS learning algorithms proposed in Berrisch & Ziel (2021) including multiple online learning algorithms such as Bernstein online aggregation as described in Wintenberger (2014).
tscopula v0.2.1: Provides functions for the analysis of time series using copula models. See McNeil (2021) and Bladt & McNeil (2020) for background. There are vignettes on Bitcoin Analysis, Models with Margins, Basic Time Series Copula Processes, and Copula Processes with V-Transforms.
Utility
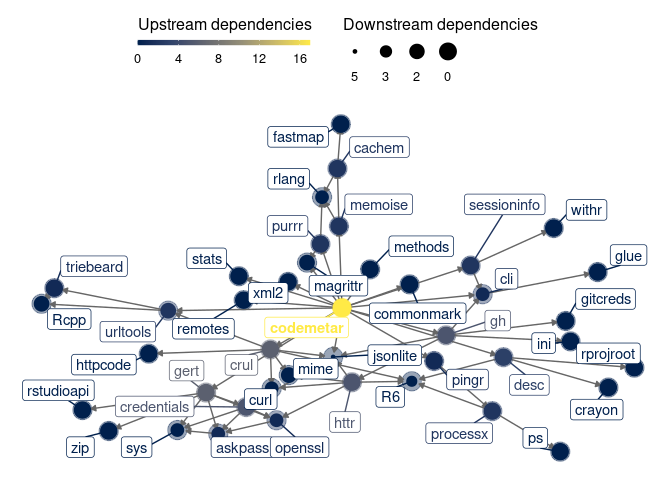
codemeta v0.1.0: Provides core utilities to generate metadata with a minimum of dependencies as specified by the Codemata Project. See README for examples.
ctf v0.1.0: Provides functions to read and write data in Column Text Format (CTF), a new tabular data format that is a simple column store. See the vignette.
fedmatch v2.0.2: Provides tools for matching two un-linked data sets using exact matches, fuzzy matches, or multi-variable matches. There is an Introduction and vignettes on Fuzzy Matching, Multivar Matching, Tier Matching, and Using clean_strings.
fusen v0.2.4: Implements a method to use R Markdown to build an R package. Users start by including documentation, functions, examples and tests in the same file. Then inflating the R Markdown template copies the relevant chunks and sections in the appropriate files required for package development. There is an Introduction and a vignette on maintaining packages.
katex v1.10: Provides functions to convert LaTeX math expressions to HTML and MATHML for use in markdown documents or package manual pages in a way which eliminates the need for embedding the MathJax library into your web pages. See the vignette.
pacs v0.3.3: Provides utilities for CRAN package maintainers and R packages developers, including tools for validating packages and exploring the complexity of a specific package. See README for a list of features and examples.
RcppFarmHash v0.0.2 Implements an interface to the The Google FarmHash family of hash functions is used by the Google BigQuery data warehouse. Look here to get started.
shinyauthr v10.0: Provides in-app user authentication for Shiny applications, allowing developers to secure publicly hosted apps and build dynamic user interfaces from user information. See README to get started.
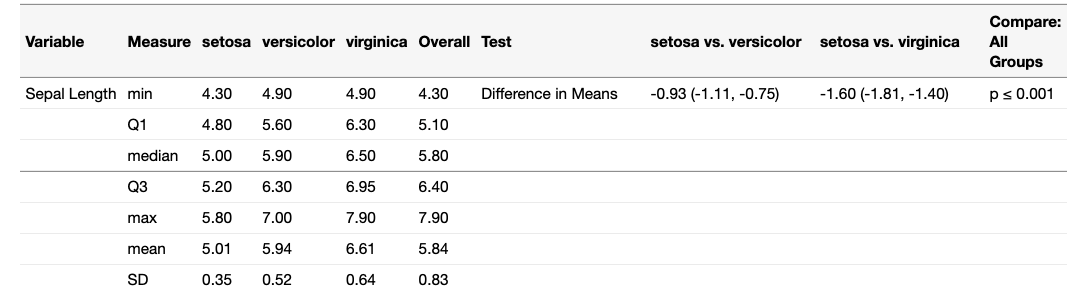
tantram.pipe v1.0.0: Allows users to build tables with customizable rows by specifying the type of data to use for each row, as well as how to handle missing data and the types of comparison tests to run on the table columns. See the vignette.
Visualization
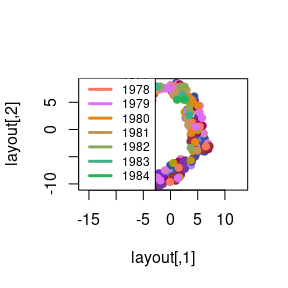
chameleon v0.2-0: Provides functions to assign distinct colors to arbitrary multi-dimensional data, considering its structure. See the vignette for examples.
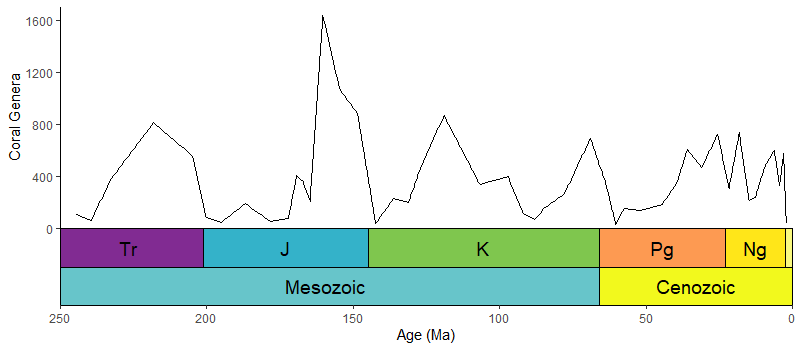
deeptime v0.1.0: Extends plotting packages such as ggplot2 and lattice to facilitate the plotting of data over long time intervals, including, but not limited to, geological, evolutionary, and ecological data. Look here for examples.
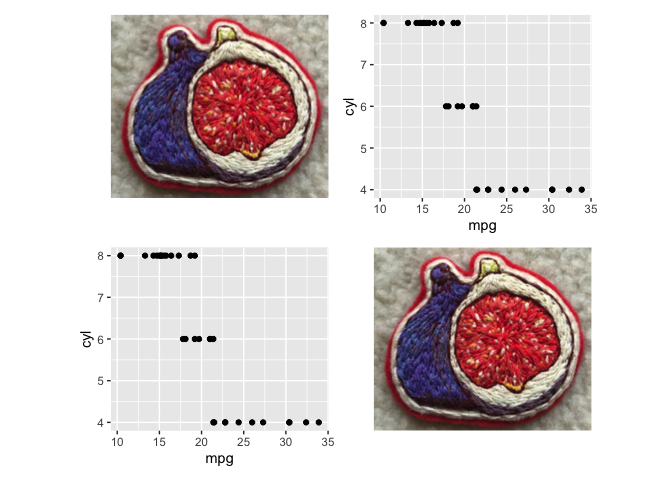
figpatch v0.1.0.1: Provides functions to arrange external figures with patchwork alongside ggplot2 plots. See README for examples.
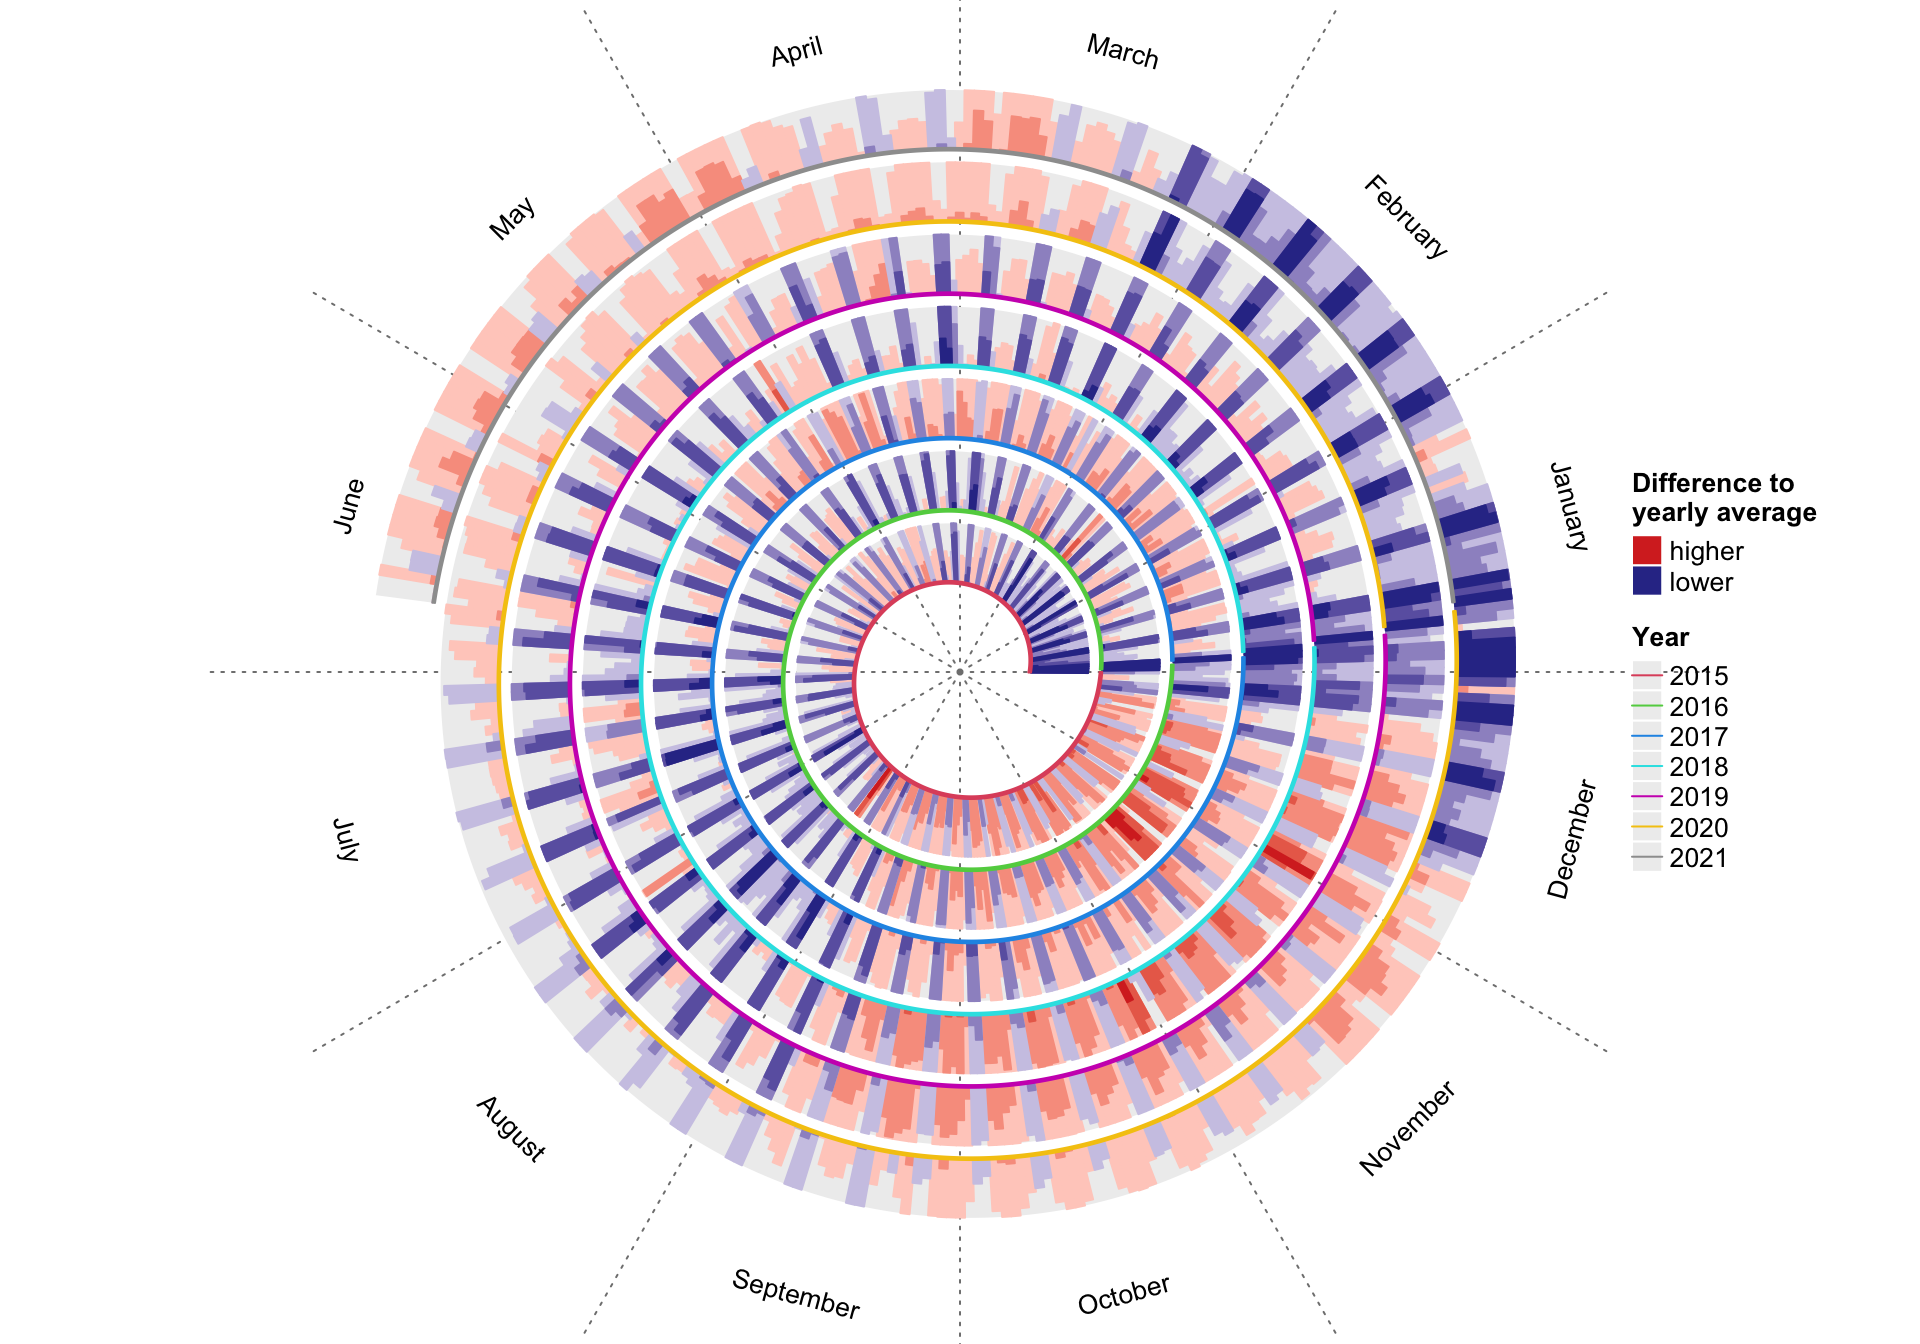
spiralize v1.0.2: Provides functions to visualize data along an Archimedean spiral which has the advantages of being able to visualize data with very a long axis with high resolution and reveal periodic patterns in time series. Look here for links to the five vignettes.
You may leave a comment below or discuss the post in the forum community.rstudio.com.