One hundred sixty new packages covering a wide array of topics made it to CRAN in August. I thought I would emphasize the breadth of topics by expanding the number of categories organizing my “Top 40” selections beyond core categories that appear month after month. Here are my picks in fourteen categories: Archaeology, Computational Methods, Data, Education, Finance, Forestry, Genomics, Machine Learning, Medicine, Science, Statistics, Time Series, Utilities, and Visualization. Based on informal impressions formed over the last several months, I believe a new category combining applications in forestry, animal populations, climate change could become a regular core category.
Archaeology
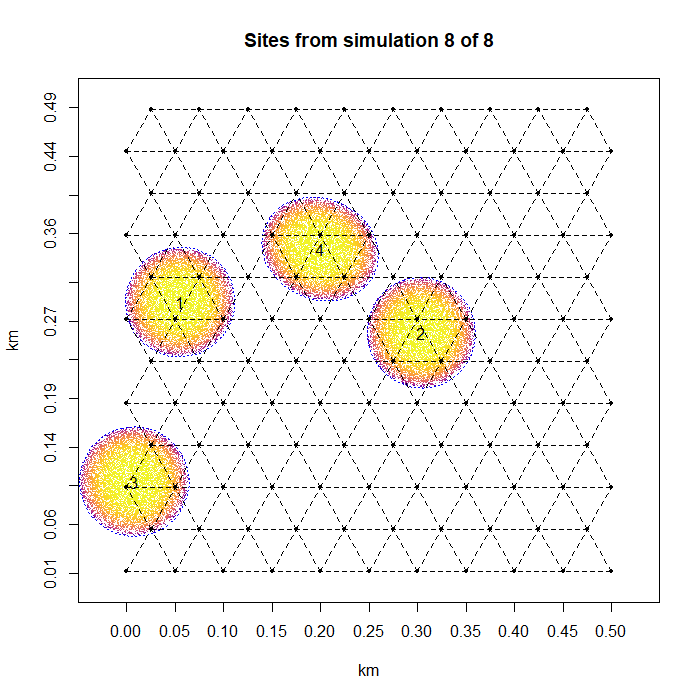
DIGSS v1.0.2: Provides a simulation tool to estimate the rate of success that surveys including user-specific characteristics have in identifying archaeological sites given specific parameters of survey area, survey methods, and site properties. See Kintigh (1988) for background and the vignette for examples.
Computational Methods
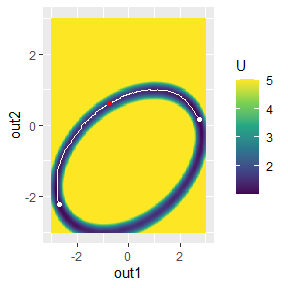
simlandr v0.1.1: Provides a set of tools for constructing potential landscapes for dynamical systems using Monte-Carlo simulation which is especially suitable for formal psychological models. There are vignettes on Dynamic Models and Simulations, Constructing Potential Landscapes, and Calculating the Lowest Elivation Path.
Data
metaboData v0.6.2: Provides access to remotely stored data sets from a variety of biological sample matrices analyzed using mass spectrometry metabolomic analytical techniques. See the vignette.
metadat v1.0-0: Contains a collection of data sets useful for teaching meta analysis. See README for more information.
nflreadr v1.1.0: Provides functions for downloading data from the GitHub repository for the nflverse project. There is a brief Introduction and several short vignettes that serve as the data dictionary for the various files Draft Picks, Rankings, etc.
OCSdata v1.0.2: Provides functions to access and download data from the Open Case Studies repositories on GitHub. See the vignette to get started.
rATTAINS v0.1.2: Implements an interface to United States Environmental Protection Agency (EPA) ATTAINS database used to track information provided by states about water quality assessments conducted under federal Clean Water Act requirements. There is a vignette.
taylor v0.2.1: Provides access to a curated data set of Taylor Swift songs, including lyrics and audio characteristics. Data comes Genius and the Spotify API. See README for examples,

Education
karel v0.1.0: Provides an R implementation of Karel the robot, a programming language for teaching introductory concepts about general programming in an interactive and fun way, by writing programs to make Karel achieve tasks in the world she lives in. There are several vignettes including one on Control Structures and another on Algorithmic Decomposition.
roger v0.99-0: Implements tools for grading the coding style and documentation of R scripts. This is the R component of Roger the Omni Grader, an automated grading system for computer programming projects based on Unix shell scripts. Look here for more information.
Finance
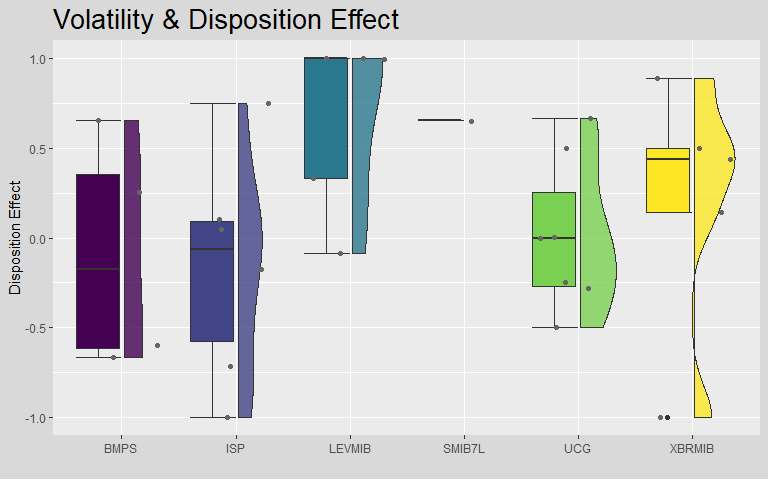
dispositionEffect v1.0.0: Implements four different methodologies to evaluate the presence of the disposition effect and other irrational investor behaviors based on investor transactions and financial market data. There is a Getting Started Guide, and vignettes on Analysis, Disposition Effects in Parallel, and Time Series Disposition Effects.
HDShOP v0.1.1: Provides functions to construct shrinkage estimators of high-dimensional mean-variance portfolios and performs high-dimensional tests on optimality of a given portfolio. See Bodnar et al. (2018), Bodnar et al. (2019), and Bodnar et al. (2020) for background.
tcsinvest v0.1.1: Implements an interface to the Tinkoff Investments API which enables analysts and traders can interact with account and market data from within R. Clients for both REST and Streaming protocols have been implemented. There is a vignette.
Forestry
APAtree v1.0.1: Provides functions to map the area potentially available (APA) using the approach from Gspaltl et al. (2012) and also aggregation functions to calculate stand characteristics based on APA-maps and the neighborhood diversity index as described in Glatthorn (2021). See the vignette for examples.
efdm v0.1.0: Implements the European Forestry Dynamics Model (EFDM), a large-scale forest model that simulates the development of a forest and estimates volume of wood harvested for any given forested area. See Packalen et al. (2015) for background and the vignette for examples.
Genomics
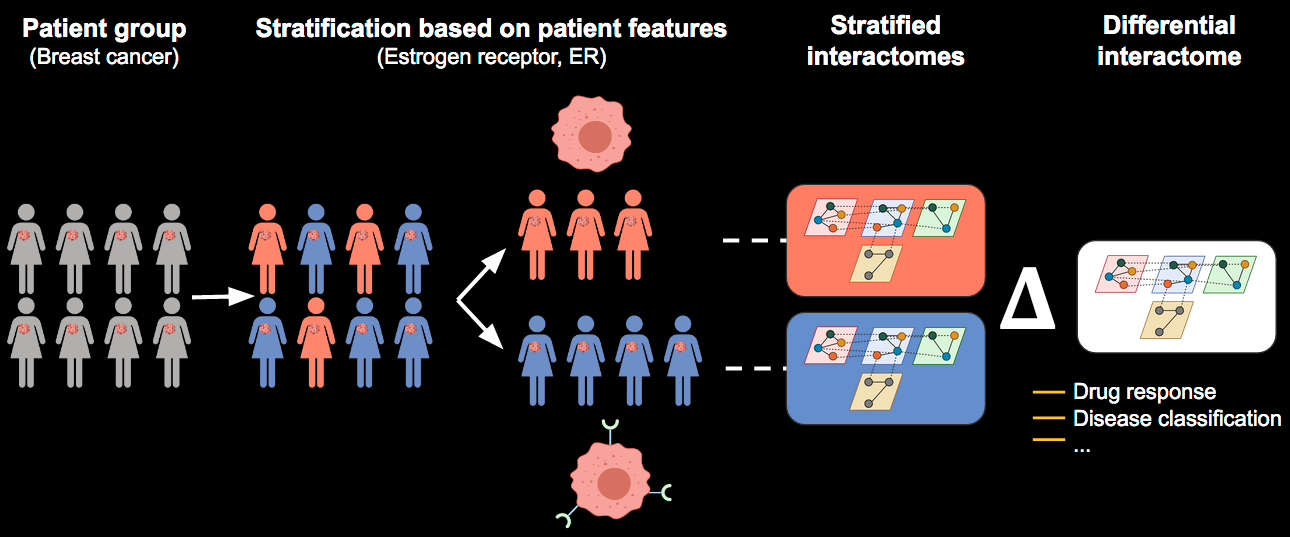
molnet v0.1.0: Implements a network analysis pipeline that enables integrative analysis of multi-omics data including metabolomics. It allows for comparative conclusions between two different conditions, such as tumor subgroups, healthy vs. disease, or generally control vs. perturbed. The case study presented in the vignette uses data published by Krug (2020).
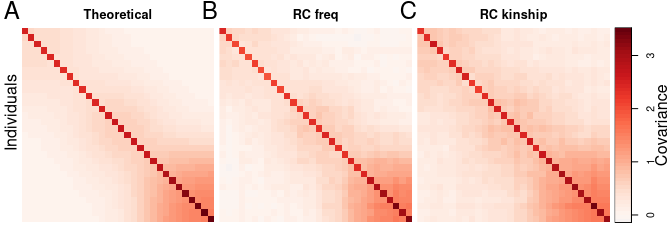
simtrait v1.0.21P Provides functions to simulate complex traits given a SNP genotype matrix and model parameters with an emphasis on avoiding common biases due to the use of estimated allele frequencies. Traits can follow three models: random coefficients, fixed effect sizes, and multivariate normal. GWAS method benchmarking functions as described in Yao and Ochoa (2019) are also provided. See the vignette.
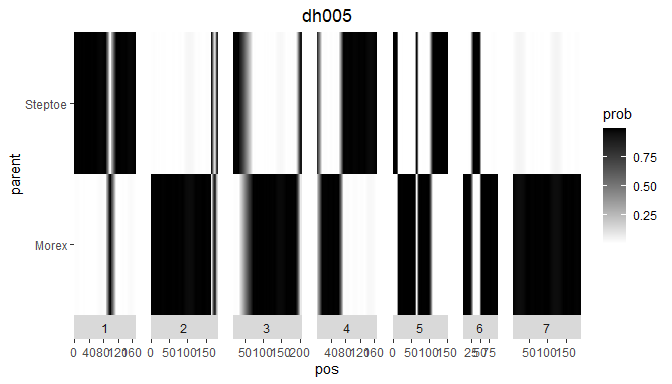
statgenIBD v1.0.1: Provides functions to calculate biparental, three and four-way crosses Identity by Descent (IBD) probabilities using Hidden Markov Models and inheritance vectors following Lander & Green (1987) and Huang (2011). See the vignette for examples.
Machine Learning
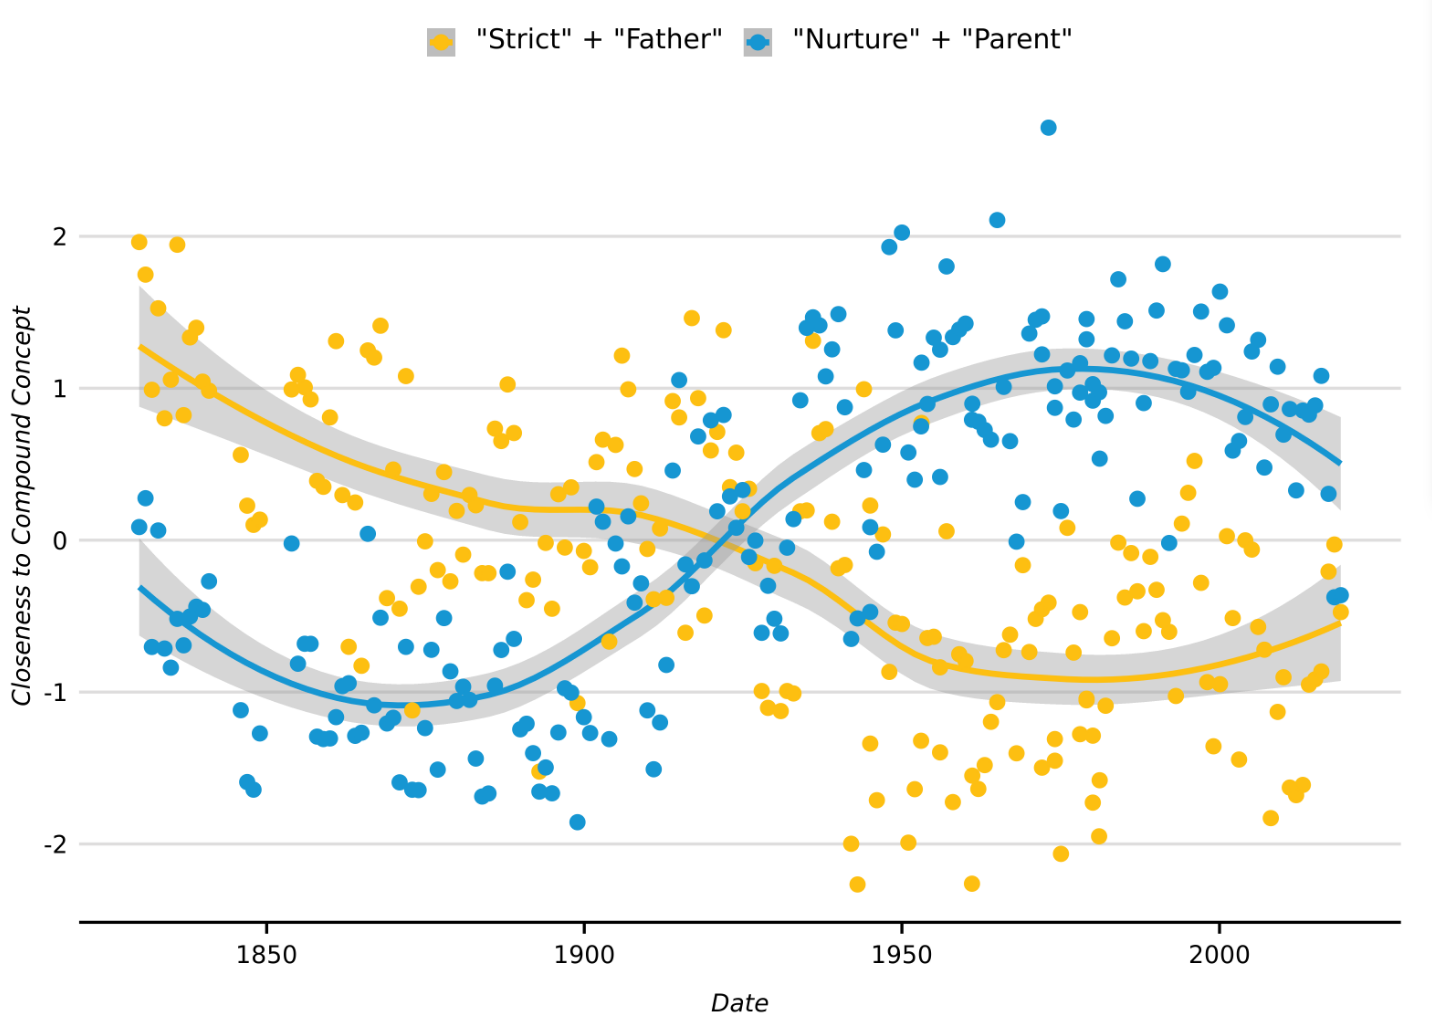
text2map v0.1.0: Provides functions for computational text analysis for the social sciences including functions for working with word embeddings, text networks, and document-term matrices. For background on the methods used see Stoltz and Taylor (2019), Taylor and Stoltz (2020), Taylor and Stoltz (2020), and Stoltz and Taylor (2021). There is a Quick Start Guide and a vignette on Concept Class Analysis.
NPRED v1.0.5: Uses partial informational correlation (PIC) to identify the meaningful predictors from a large set of potential predictors. Details can be found in Sharma & Mehrotra, (2014), Sharma et al.(2016), and Mehrotra & Sharma (2006). See the vignette for examples.
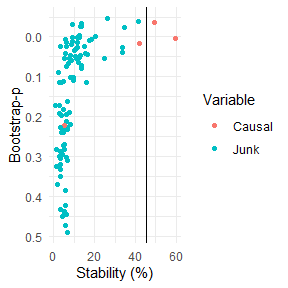
stabiliser v0.1.0: Implements an approach to variable selection through stability selection and the use of an objective threshold based on permuted data. See Lima et al (2021) and Meinshausen & Buhlmann (2010) for details and the vignette for an example.
Medicine
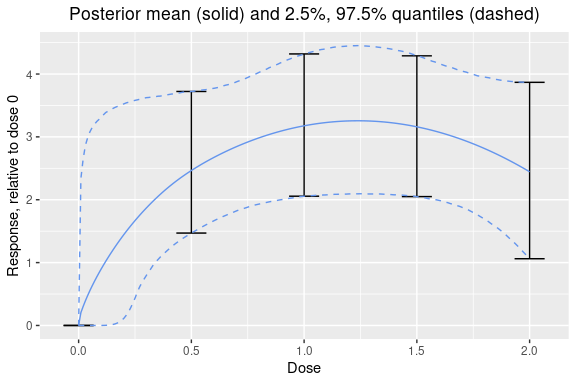
dreamer v3.0.0: Fits longitudinal dose-response models utilizing a Bayesian model averaging approach as outlined in Gould (2019) for both continuous and binary responses. See the vignette.
smartDesign v0.72: Implements the SMART trial design, as described by He et al. (2021) which includes multiple stages of randomization where participants are randomized to an initial treatment in the first stage and then subsequently re-randomized between treatments in the following stage. There is a Dynamic Treatment Tutorial and a Sequential Design Tutorial.
Science
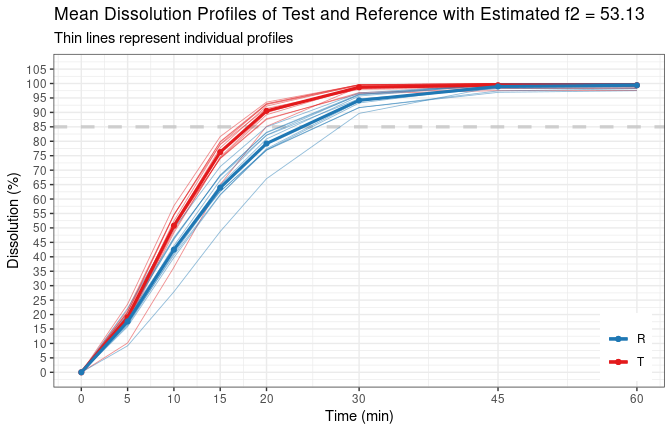
bootf2 v0.4.1: Provides functions to compare dissolution profiles with confidence intervals of the similarity factor f2 and also functions to simulate dissolution profiles. There are multiple vignettes including and Introduction a Simulation Example.
track2KBA v1.0.1: Provides functions to prepare and analyze animal tracking data in order to identify areas of potential interest for population level conservation. See Lascelles et al. (2016) for background on the methodology employed and the vignette for examples and workflow.

Statistics
chyper v0.3.1: Provides functions to work with the conditional hypergeometric distribution. See the vignette.
sprtt v0.1.0: Provides functions to perform sequential t-tests including those of Wald (1947), Rushton (1950), Rushton (1952), and Hajnal (1961). There is an Introduction to the package, a Use Case, and a vignette on the Sequential t-test.
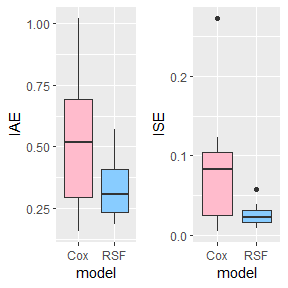
SurvMetrics v0.3.5: Implements popular evaluation metrics commonly used in survival prediction including Concordance Index, Brier Score, Integrated Brier Score, Integrated Square Error, Integrated Absolute Error and Mean Absolute Error. For detailed information, see Ishwaran et al. (2008) and Moradian et al. (2017). The vignette offers examples.
Time Series
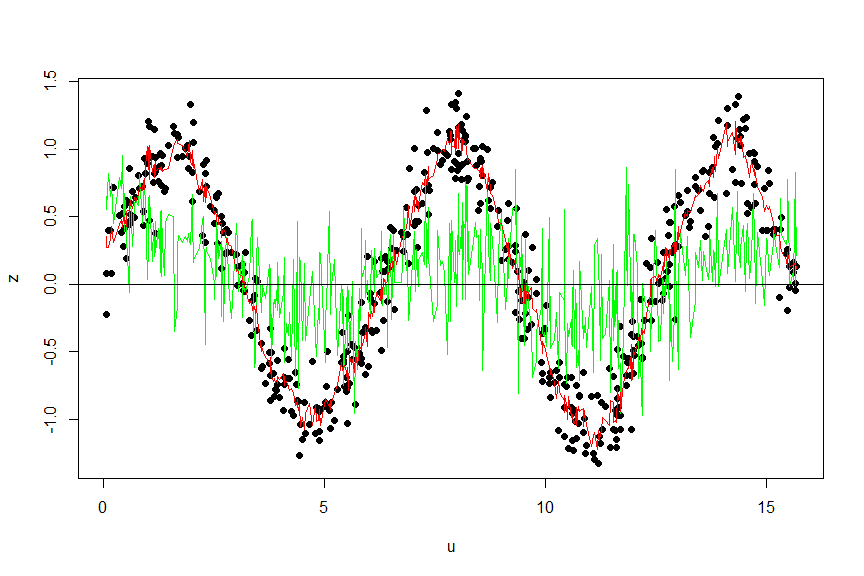
DCSmooth v1.0.2: Implements nonparametric smoothing techniques for data on a lattice or functional time series which allow for modeling a dependency structure of the error terms of the nonparametric regression model. See Beran & Feng (2002), Mueller & Wang (1994), Feng & Schaefer (2021), and Schaefer & Feng (2021) for the background and the vignette for examples.
STFTS v0.1.0: Implements statistical hypothesis tests of functional time series including a functional stationarity test, a functional trend stationarity test and a functional unit root test.
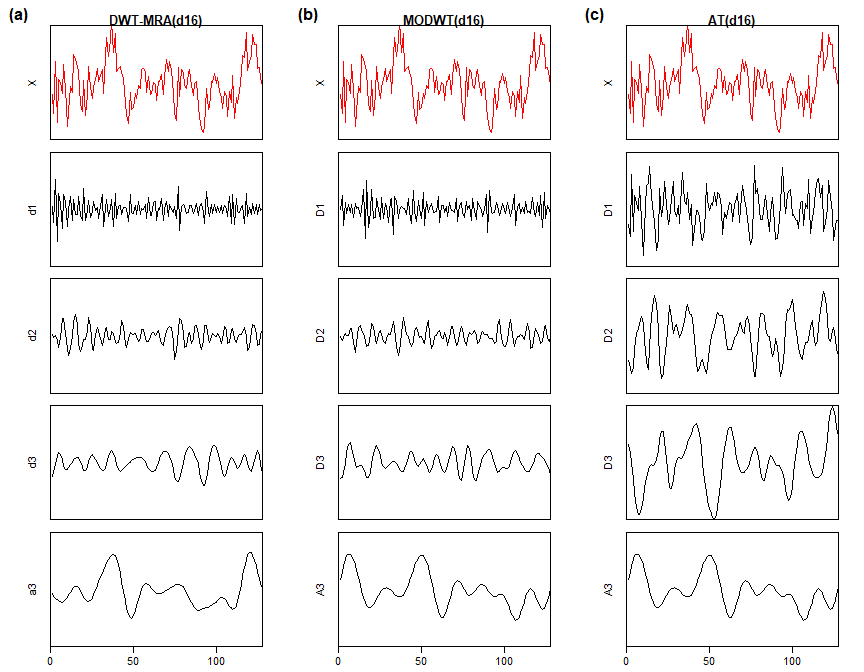
WASP v1.4.1: Implements wavelet-based variance transformation methods for system modeling and prediction. For details see Jiang et al. (2020), Jiang et al. (2020), and Jiag et al. (2021) There is a vignette with examples.
Utilities
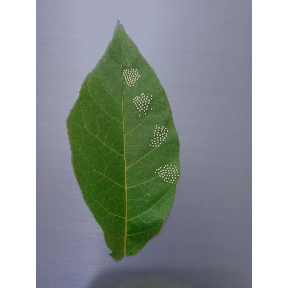
ExpImage v0.2.0: Provides an image editing tool for researchers which includes functions for segmentation and for obtaining biometric measurements. There are several vignettes including: Contagem de bovinos, Contagem de objetos, and Como editar imagens.
meltr v1.0.0: Provides functions to read non-rectangular data, such as ragged forms of csv (comma-separated values), tsv (tab-separated values), and fwf (fixed-width format) files. See README to get started.
plumbertableau v0.1.0: Implements tools for building plumber APIs that can be used in Tableau workbooks. There is a package Introduction and vignettes on Writing Extensions, Using Extensions in Tableau, and Publishing Extensions to RStudio Connect.
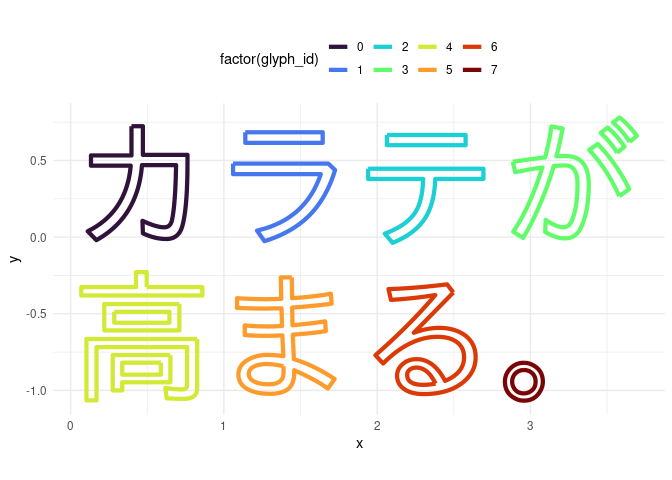
string2path v0.0.2: Provides functions to extract glyph information from a font file, translate the outline curves to flattened paths or tessellated polygons, and return the results as a data.frame. See README for an example.
trackdown v1.0.0: Uses Googel Drive to implement tools for collaborative writing and editing of R Markdown and Sweave documents. There are some Tech Notes and vignettes on Features and Workflow.
Visualization
aRtsy v0.1.1: Provides algorithms for creating artwork in the ggplot2 language that incorporate some form of randomness. See README for examples and package use.

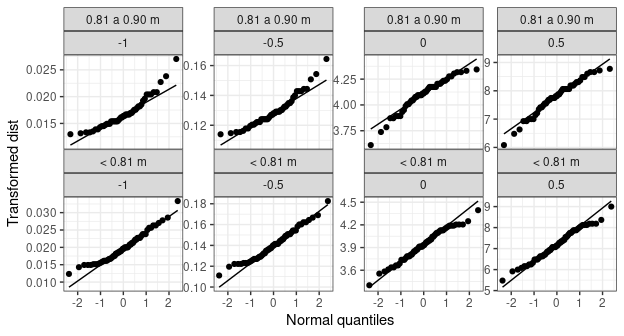
ggcleveland v0.1.0: Provides functions to produce ggplot2 versions of the visualization tools described in William Cleveland’s book Visualizing Data. The vignette contains several examples.
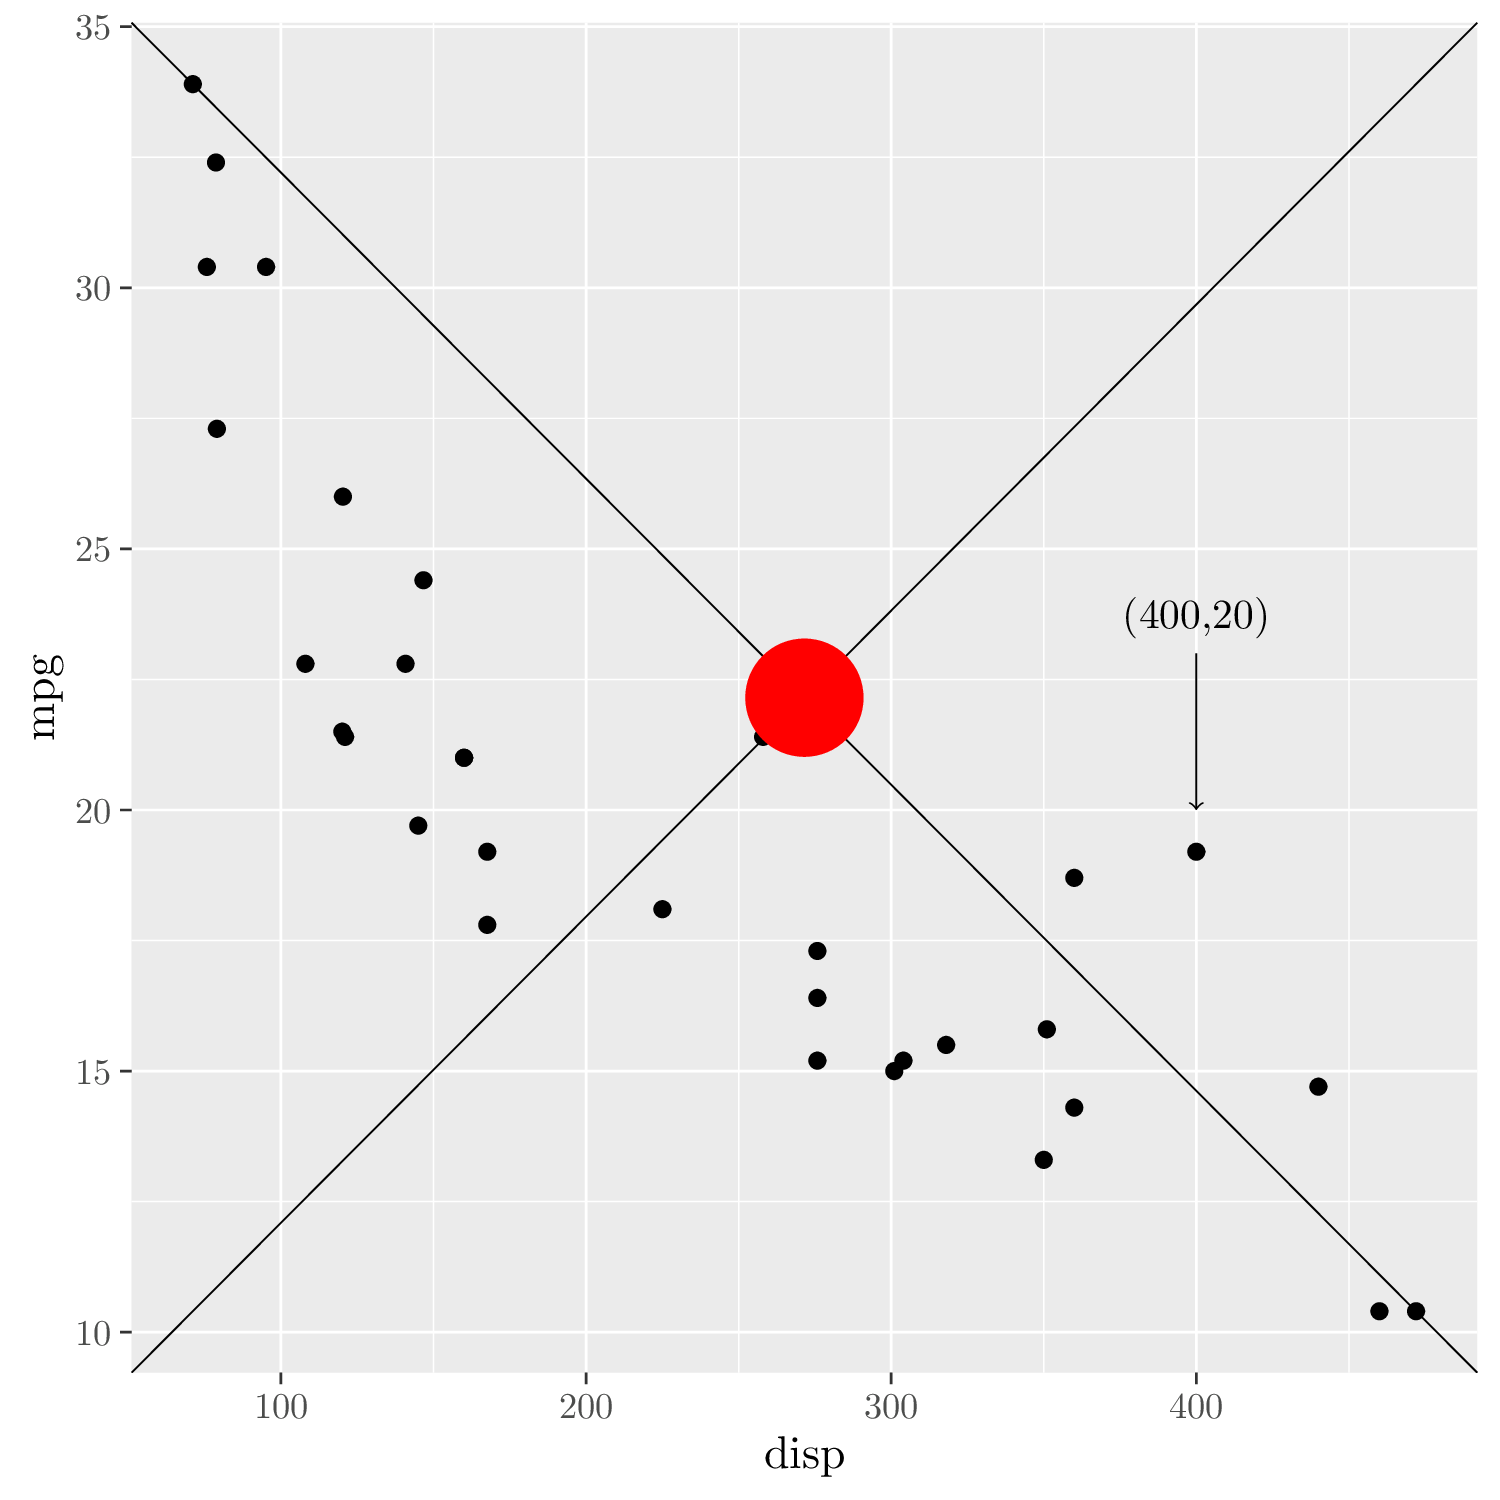
ggtikz v0.0.1: Provides tools to annotate ggplot2 plots with TikZ code using absolute data or relative coordinates. See the vignette.
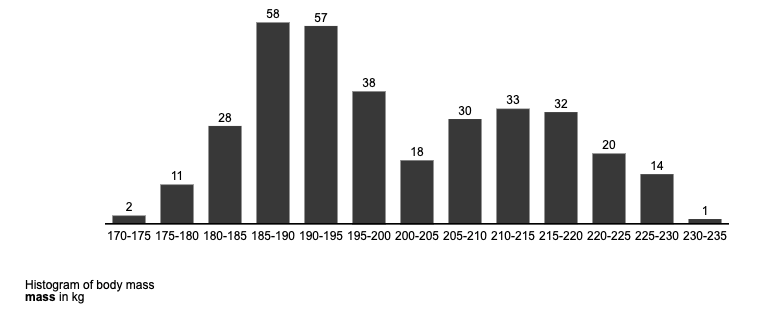
tidycharts v0.1.2: Provides functions to generate charts compliant with the International Business Communication Standards (IBCS) including unified bar widths, colors, chart sizes, etc. There is a Getting Started guide and vignettes on EDA, Customization, and Joining Charts.
You may leave a comment below or discuss the post in the forum community.rstudio.com.