This will be my final R Views post offering my totally idiosyncratic selection of 40 CRAN packages. It has been a good run that began in August 2016. I would like to thank all of you who followed these posts. Your readership kept me going. I hope that the “Top 40” posts were somewhat useful for helping you to keep up with the explosion of creativity in the R Community.
I would also like to thank the guest authors who contributed posts to R Views over the years. It has been a pleasure and privilege to work with all of you. Please find a way to keep writing about R. When you do have something to share on R Views, I am certain you will enjoy working with R Views’ new senior editor, Isabella Velásquez as I have. It has been my great pleasure to collaborate with Isabella.
One hundred ninty-eight new packages stuck to CRAN in May. (I identified eight packages that were removed between the end of may and the 24th of June.) Here are my “Top 40” selections in fifteen categories Astronomy, Biology, Chemistry, Climate Science, Computational Methods, Data, Ecology, Engineering, Finance, Genomics, Mathematics, Medicine, Statistics, Utilities, and Visualization.
Astronomy
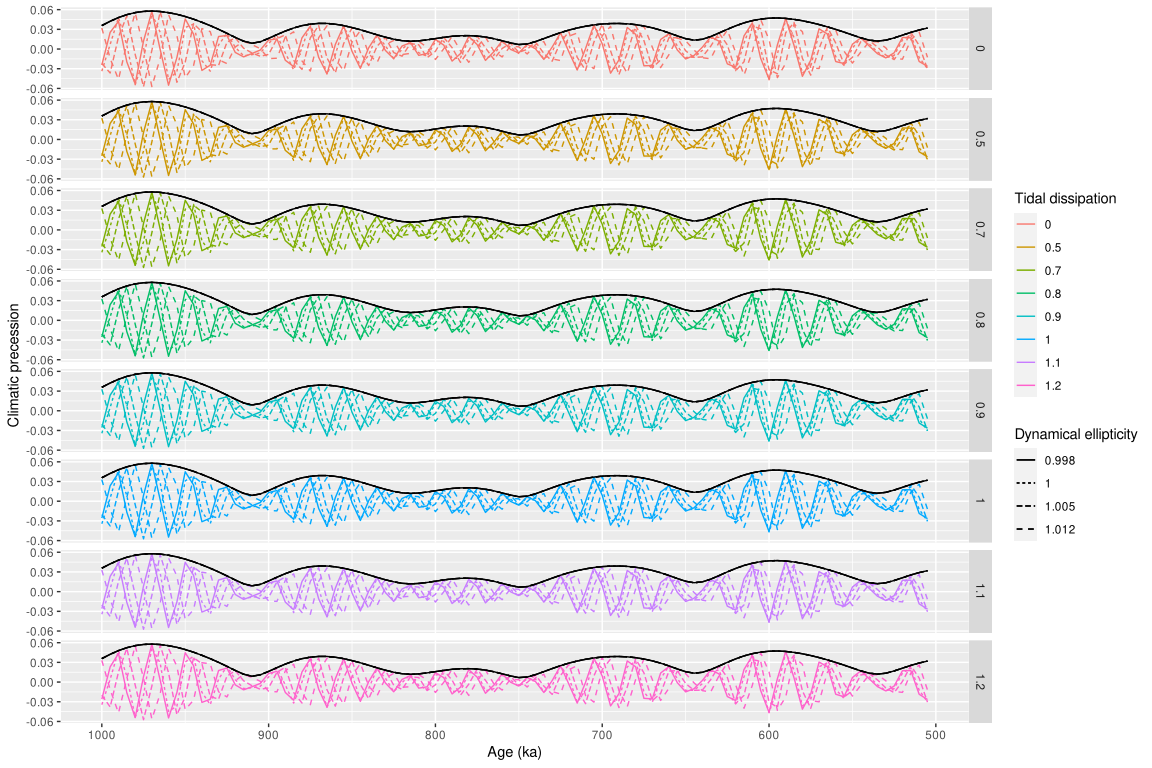
snvecR v3.7.7: Provides functions to calculate precession and obliquity from an orbital solution and assumed or reconstructed values for tidal dissipation and dynamical ellipticity. See Zeebe and Lourens (2022) for background and the vignette for examples.
Biology
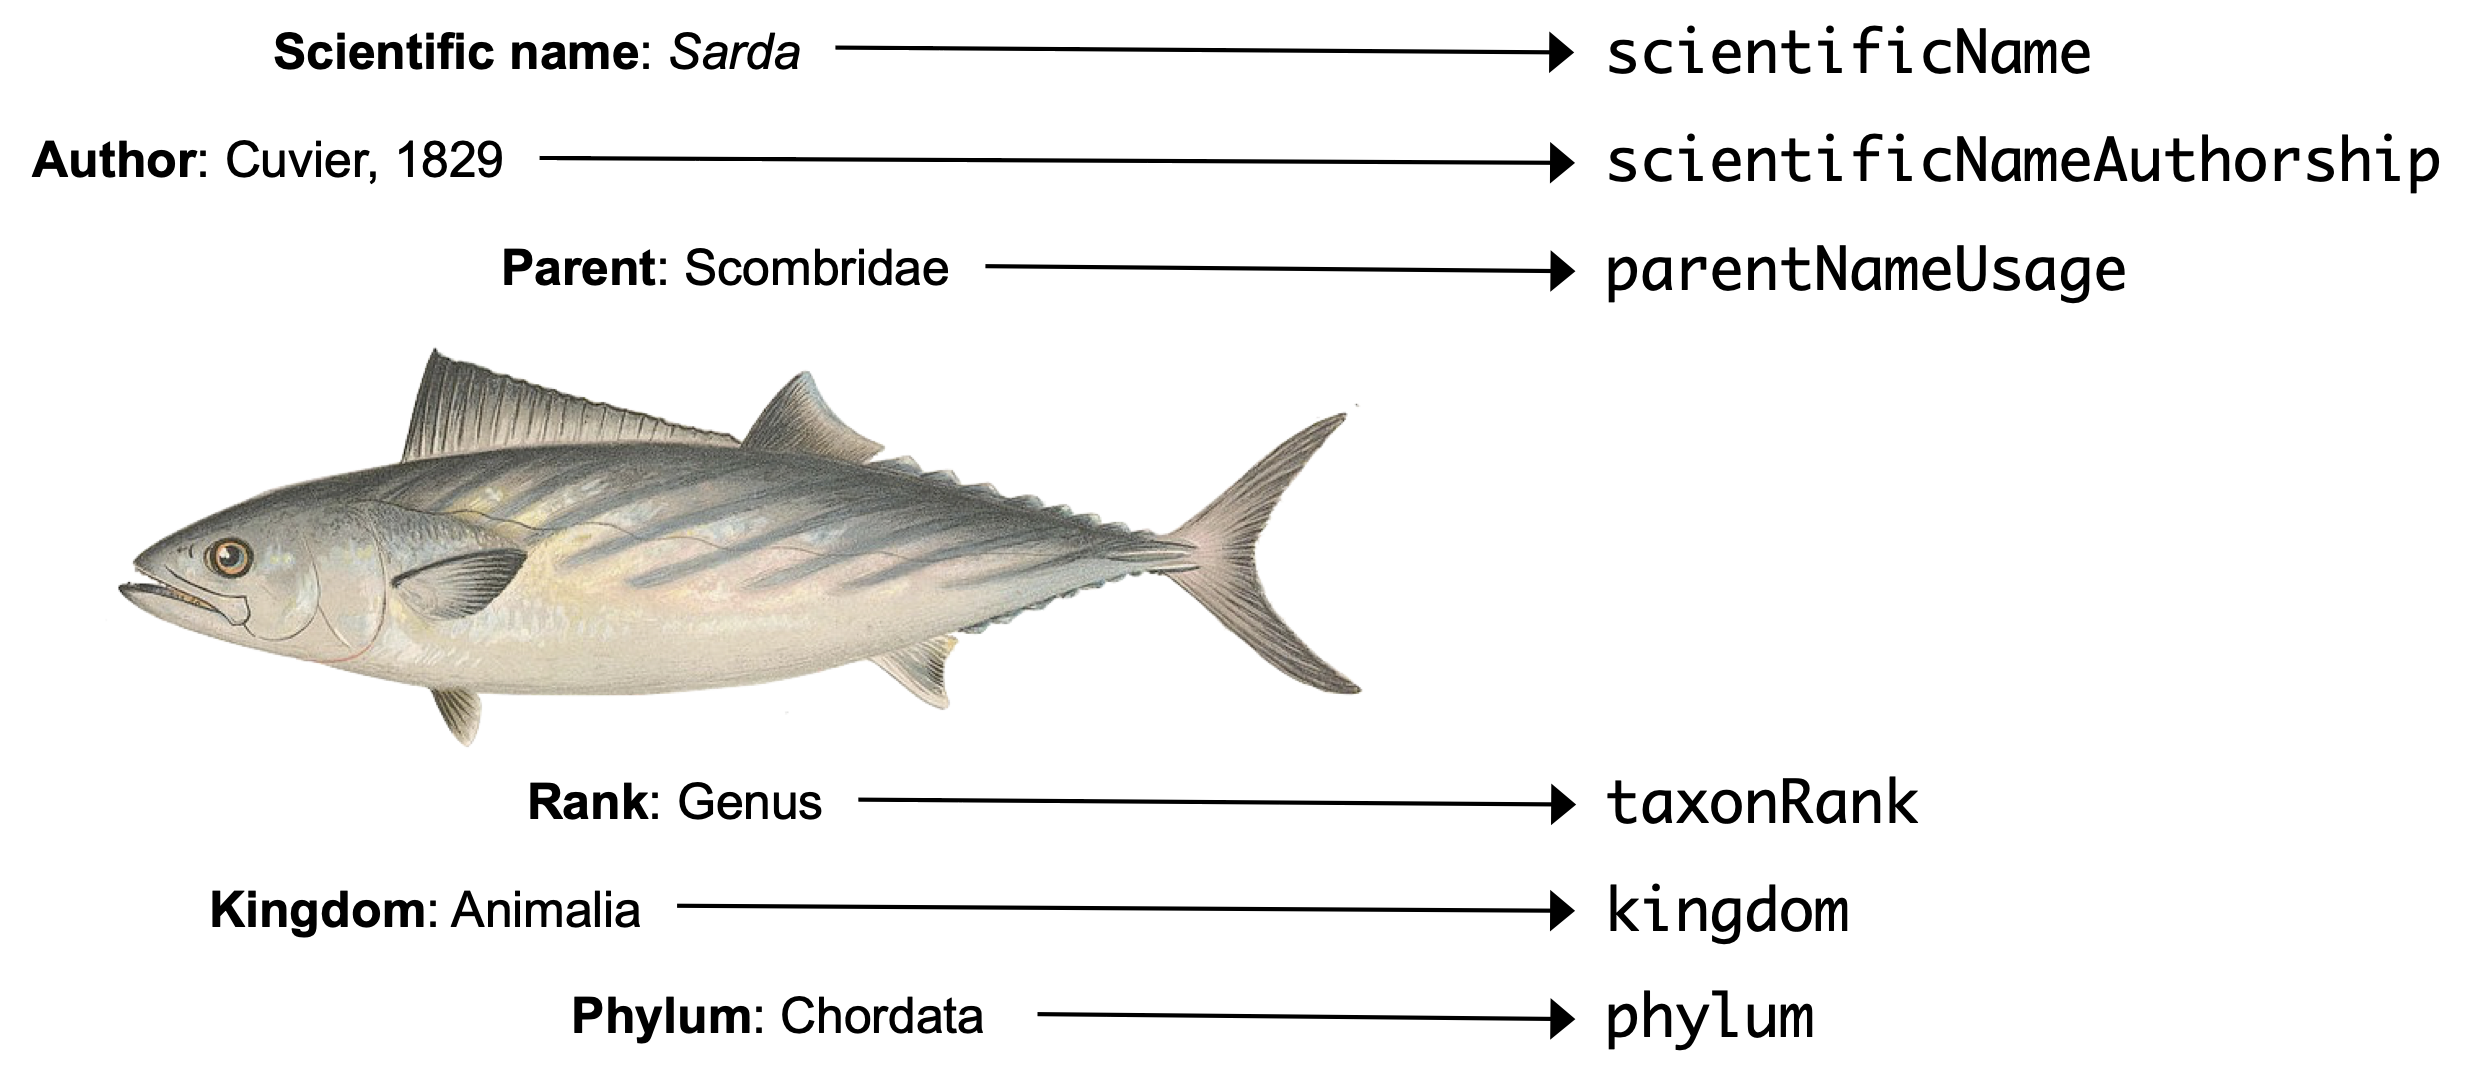
dwctaxon v2.0.2: Provides tools to edit and validate taxonomic data in compliance with Darwin Core standards (Darwin Core Taxon class). There is an Indroduction, an Example, and there are vignettes on Editing and Validating texon data.
Chemistry
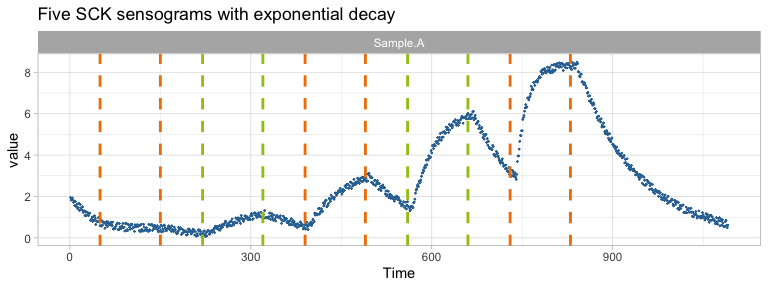
anabel v3.0.1: Implements tools suitable for high-throughput analysis of 1:1 molecular interaction studies. See Kraemer et al. (2019) and Norval et al. (2019) for background and the vignette for examples.
Climate Science
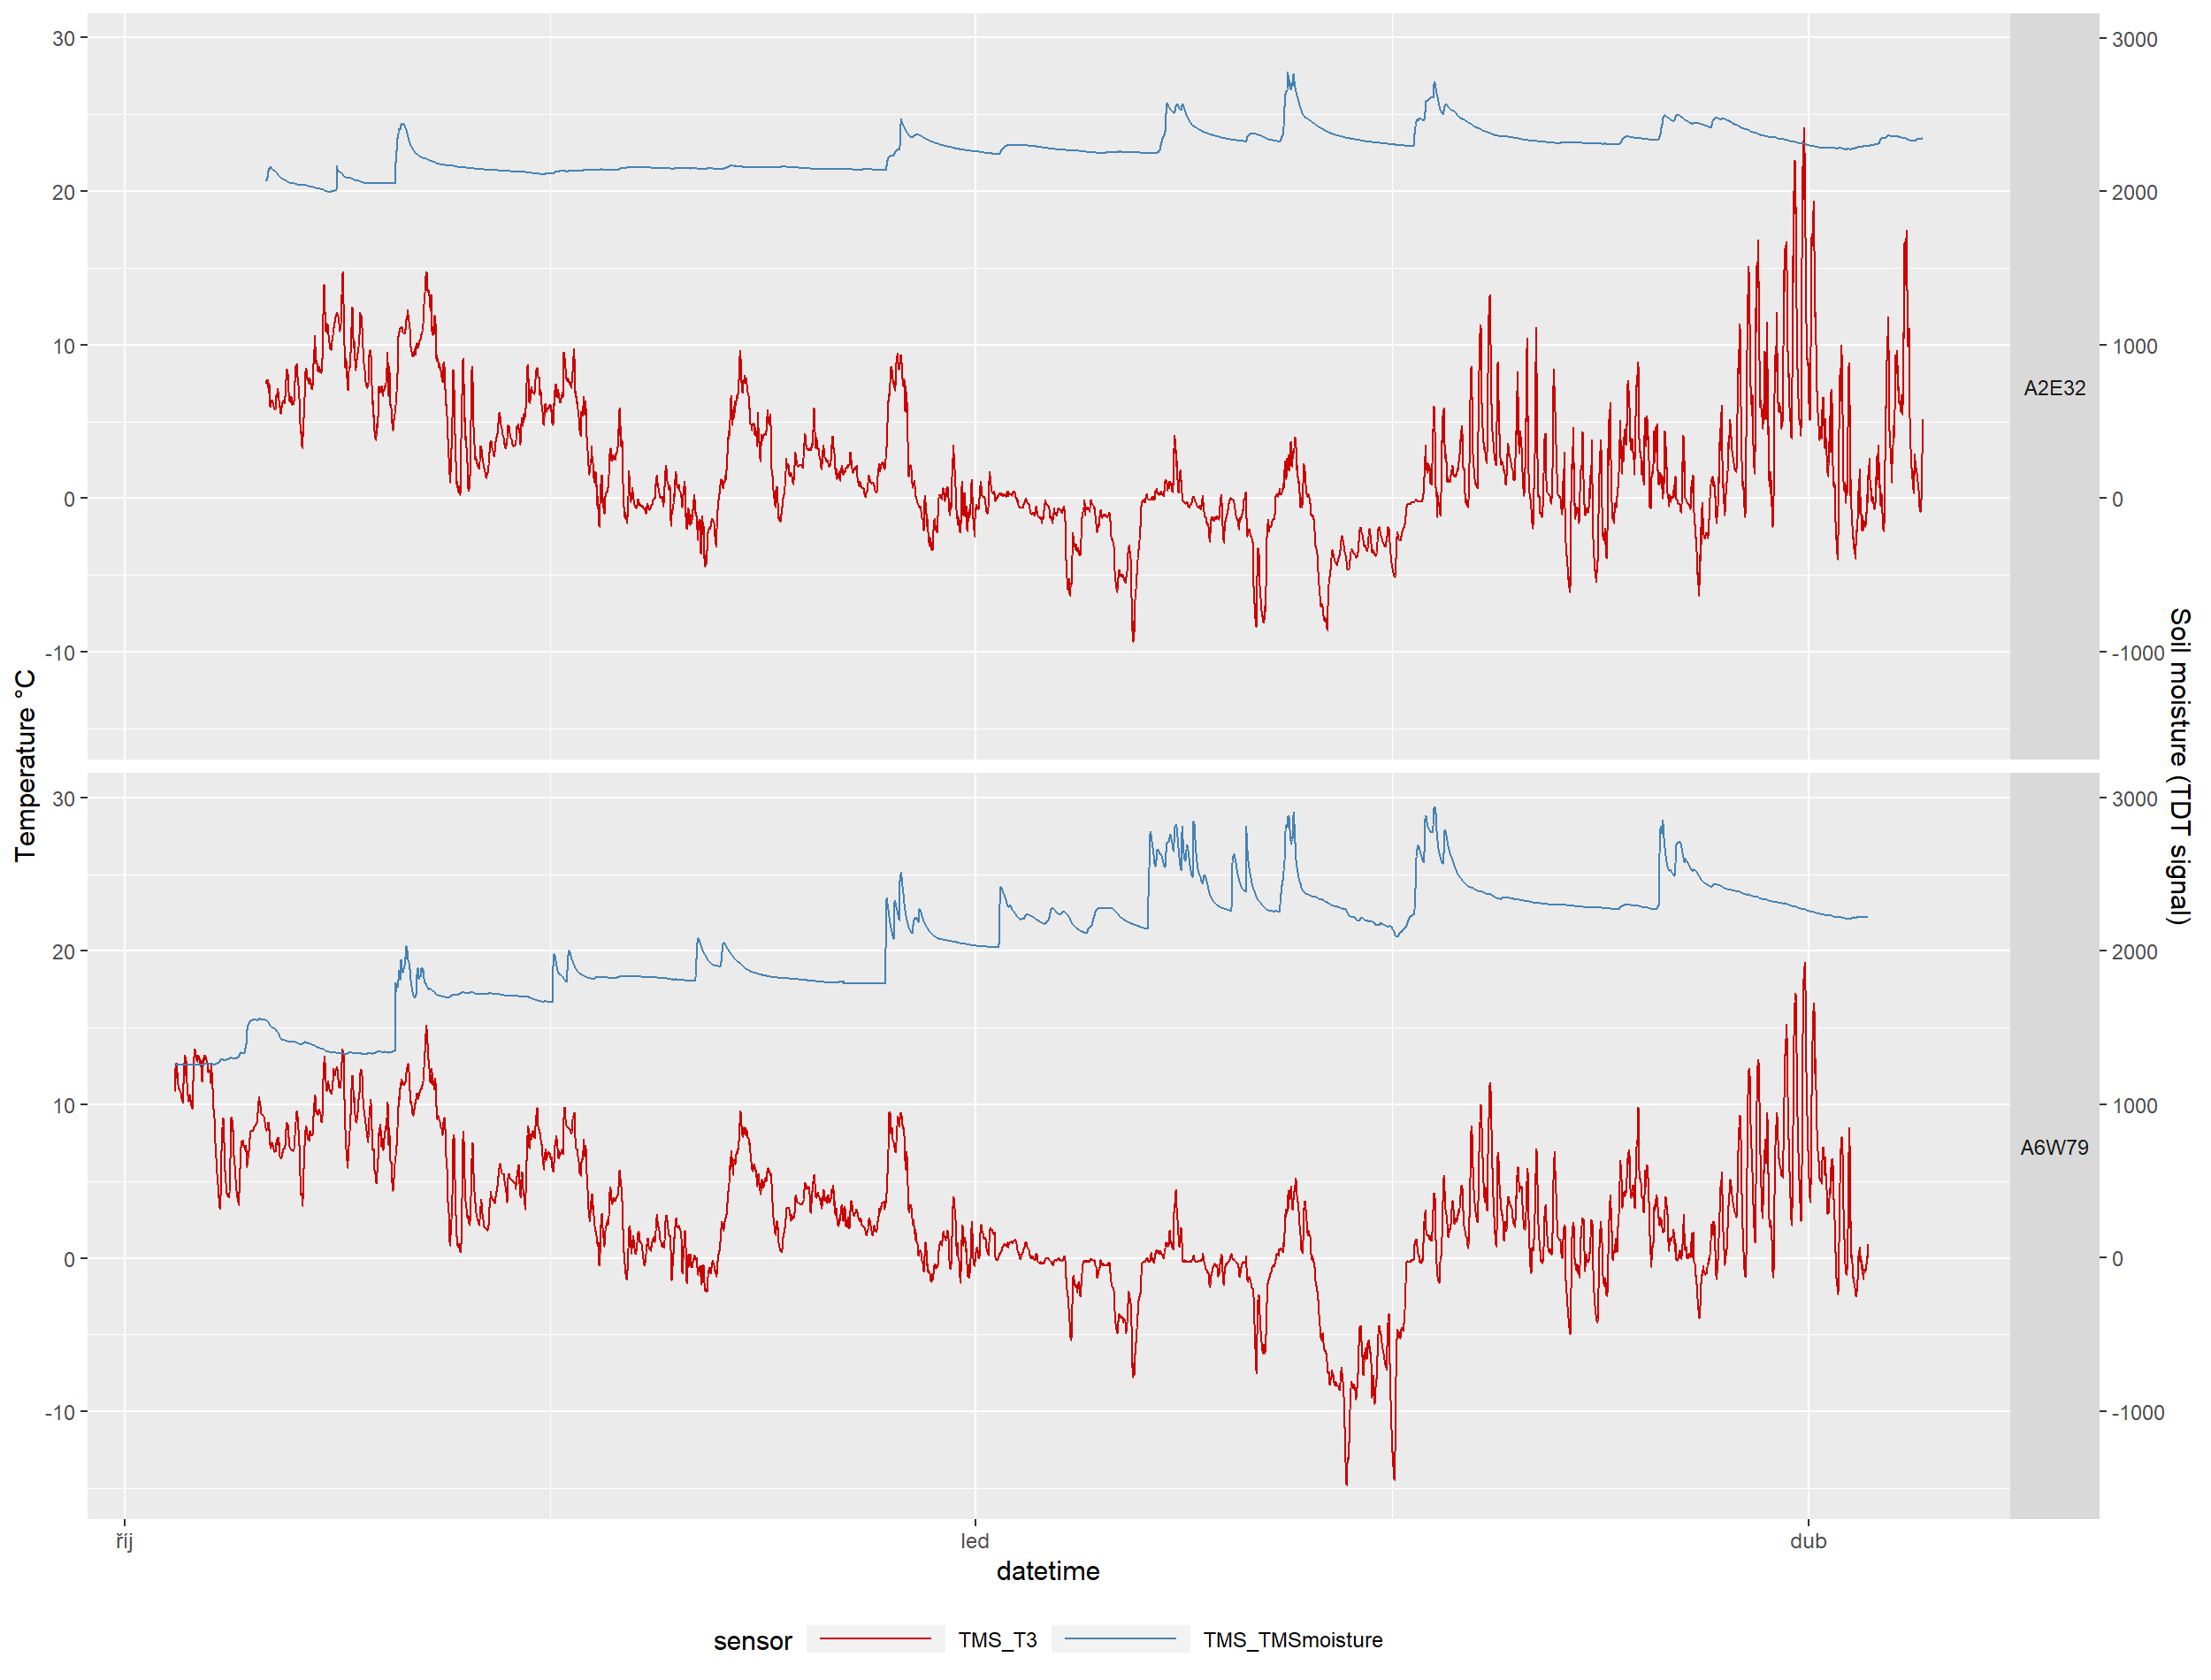
myClim v1.0.1: Provides functions for working with microclimate data including reading, converting data formats, sorting into localities, computing microclimate variables, and plotting. See the vignette.
Computational Methods
matrixset v0.1.1: Provides functions to create, store, manipulate and code with matrix ensembles, matrices that share common properties. See the Gentle Introduction, the example, and the vignettes on annotation, applying functions.
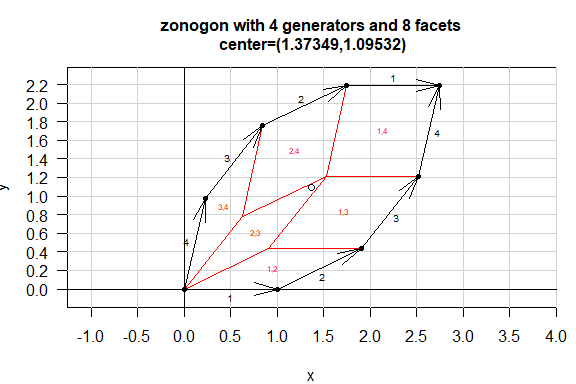
zonohedra v0.2-2: Provides functions to compute and plot zonohedra from vector generators. See Hecbert (1985) for the optimization methods. Vignettes include a User Guide, Matroids, Ray tracing zonohedron boundaries, Transition subcomplex and surface, and Zonotopes.
woyler v0.0.5: Provides functions for generating a tour path by interpolating between d-D frames in p-D space using Givens rotations. See Buja et al (2005) for background on high dimensional rotations, the Introduction and the vignette on Plotting.
Data
appeears v1.0: Implements a programmatic interface to the NASA Application for Extracting and Exploring Analysis Ready Samples services (AppEEARS) providing easy access to analysis ready earth observation data. See the vignette.
BRVM v5.0.0: Provide real-time access to data from the Regional Securities Exchange SA, commonly known as the BRVM stock exchange.
denguedatahub v1.0.4: Provides a weekly, monthly, yearly summary of dengue cases by state, province, or country. Look here for information on the data provided.
Ecology
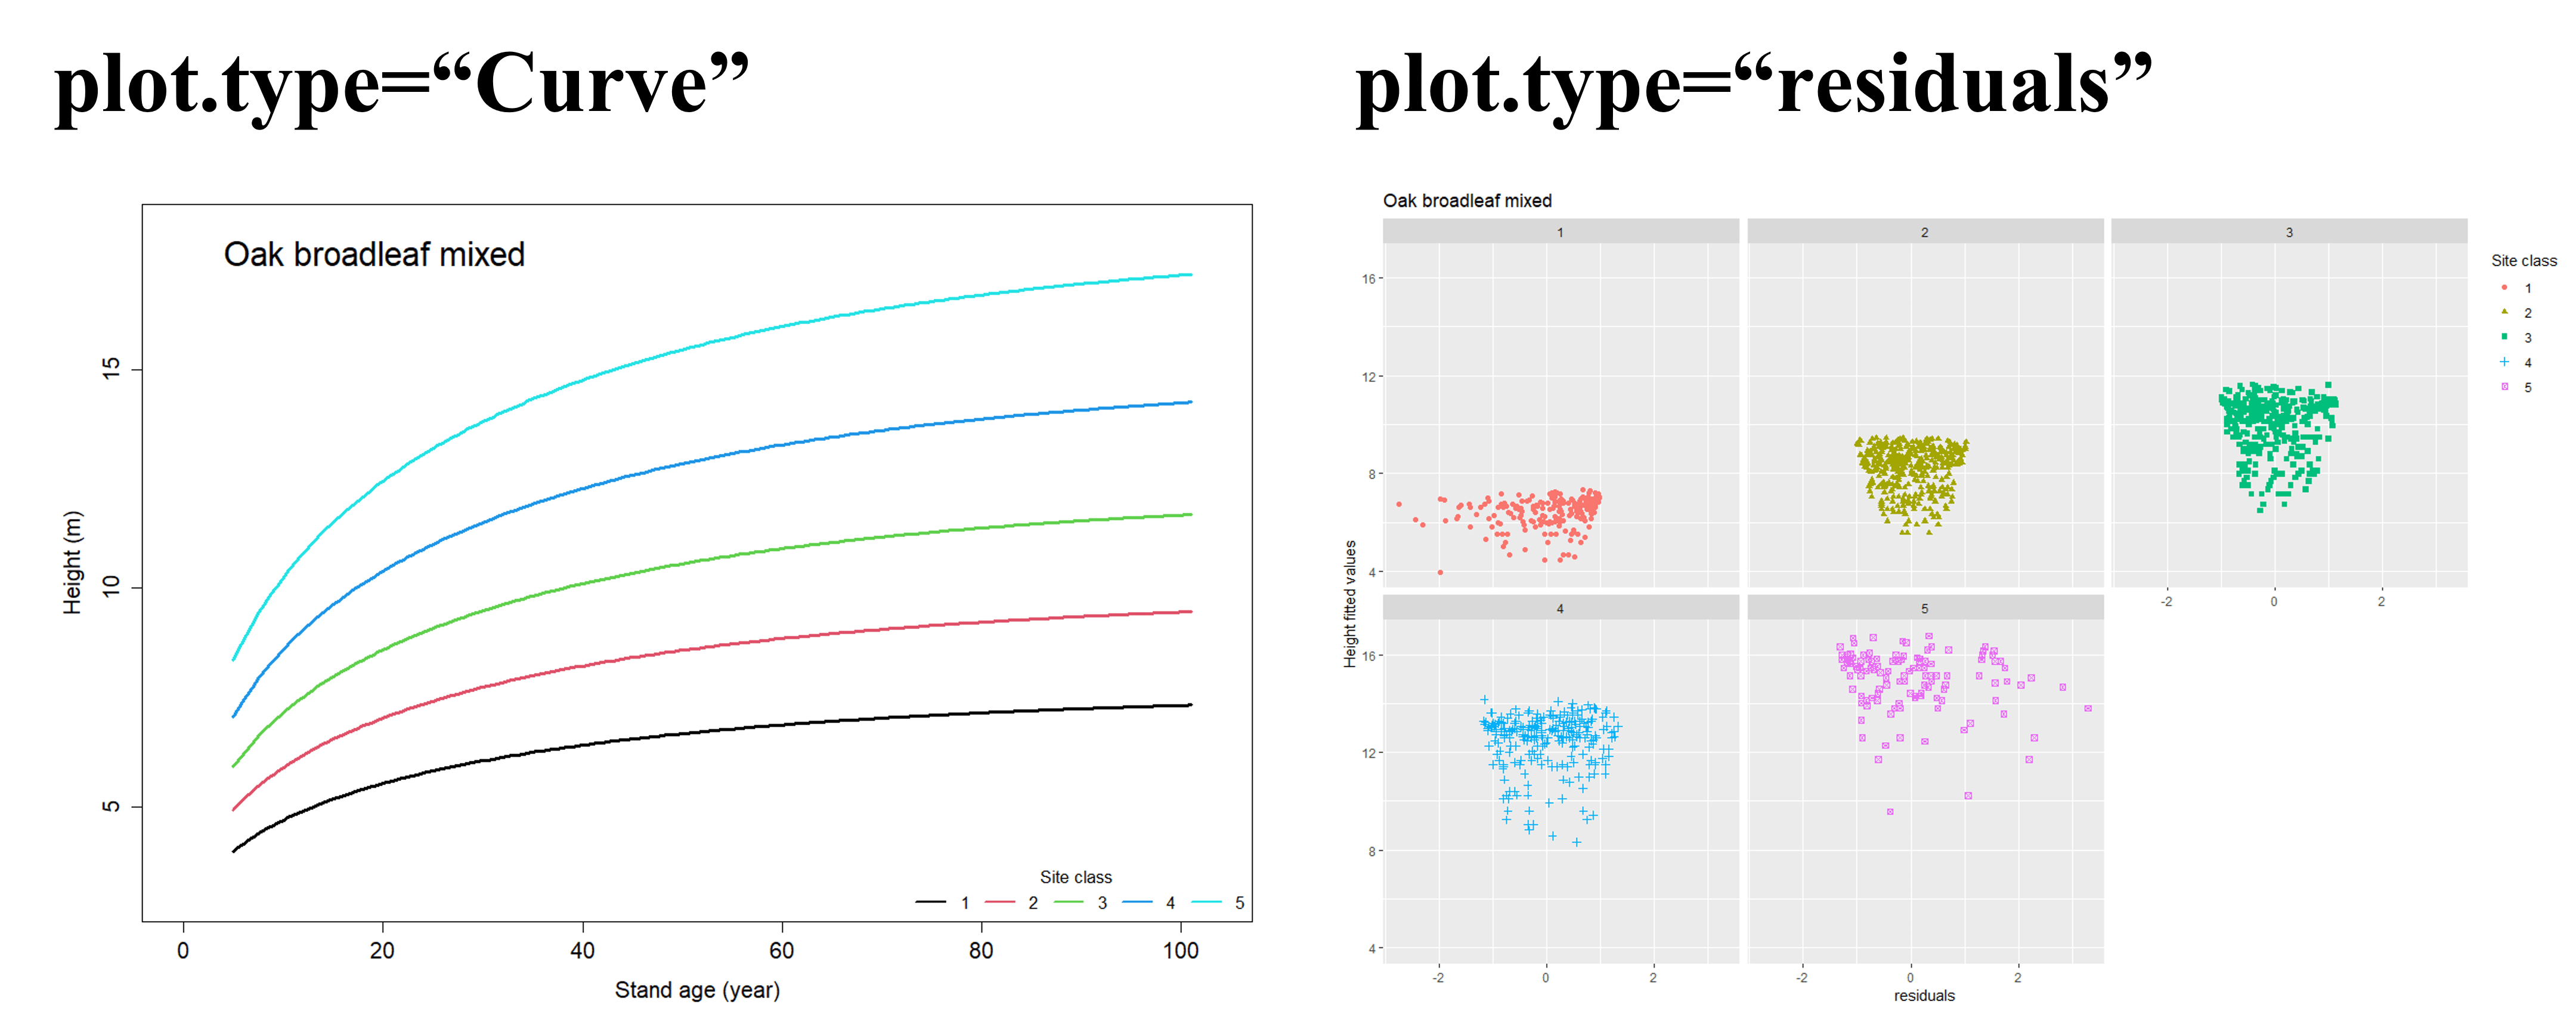
forestat v1.0.1: Provides functions for evaluating the quality of a natural forest including tree height classification, tree height model establishment, sectional area growth and stock growth modeling, and for calculating actual and potential forest productivity. see the vignette.
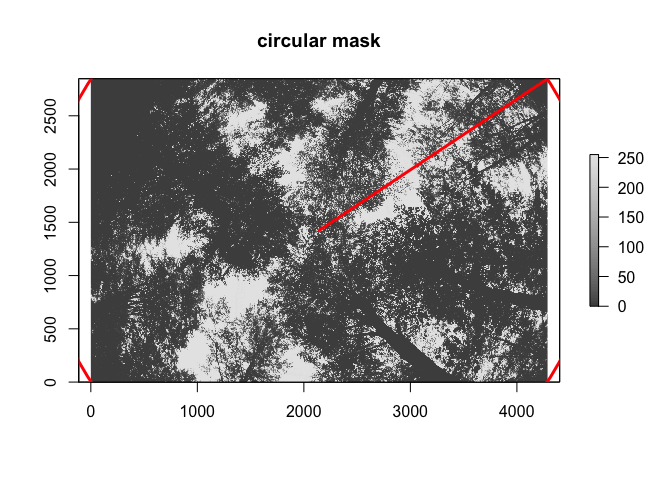
hemispheR v0.2.0: Provides functions for processing hemispherical canopy images including functions to import and classify canopy fish-eye images, estimate angular gap fraction and derive canopy attributes like leaf area index and openness. See Chianucci & Macek (2023) for details and README for examples.
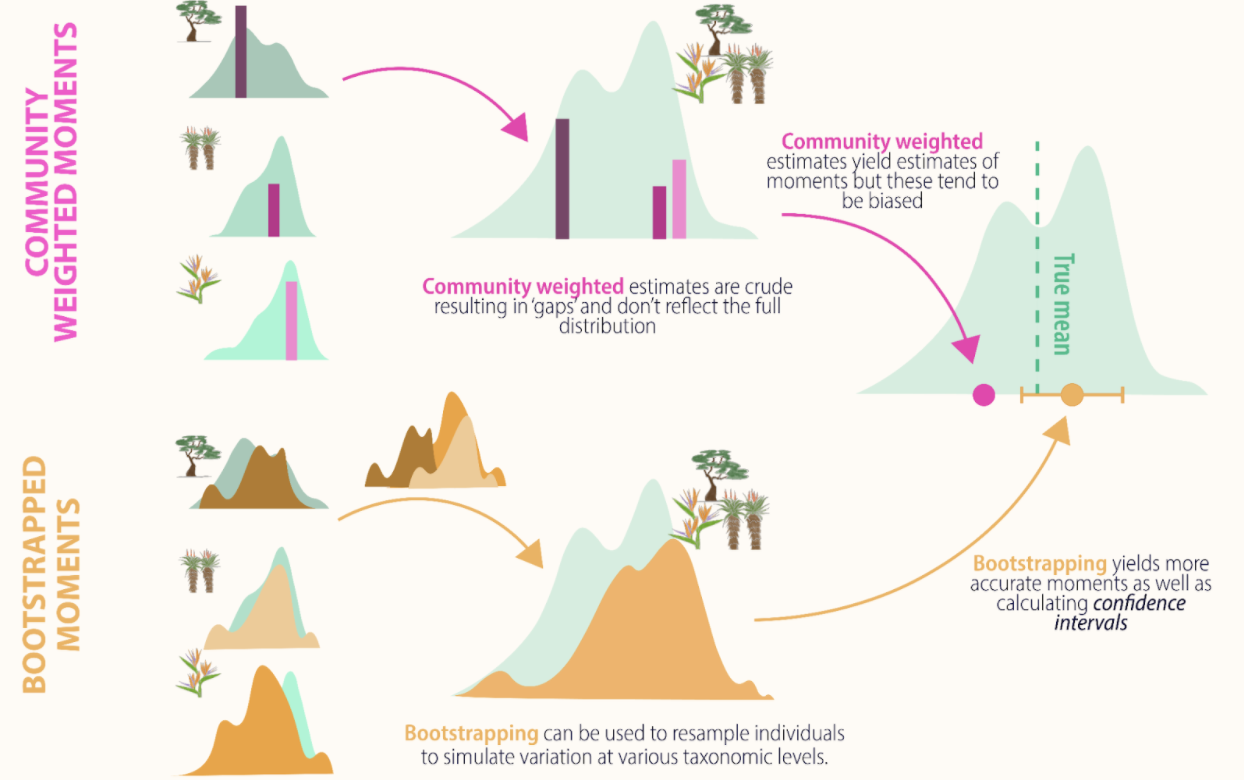
traitstrap v0.1.0: Calculates trait moments from trait and community data using the methods developed in Maitner et al (2021). See the vignette for an introduction and the playlist, a definite innovation in R package vignettes.
Engineering
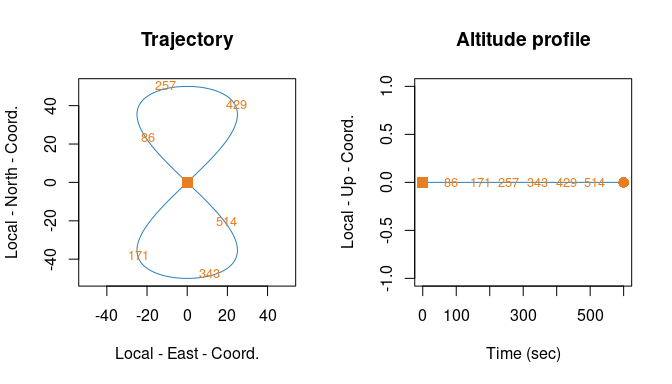
navigation v0.0.1: Implements the framework presented in Cucci et al. (2023) which allows analyzing the impact of sensor error modeling on the performance of integrated navigation (sensor fusion) based on inertial measurement unit (IMU), Global Positioning System (GPS), and barometer data. See the vignettes Compare Models and Model Evaluation.
Finance
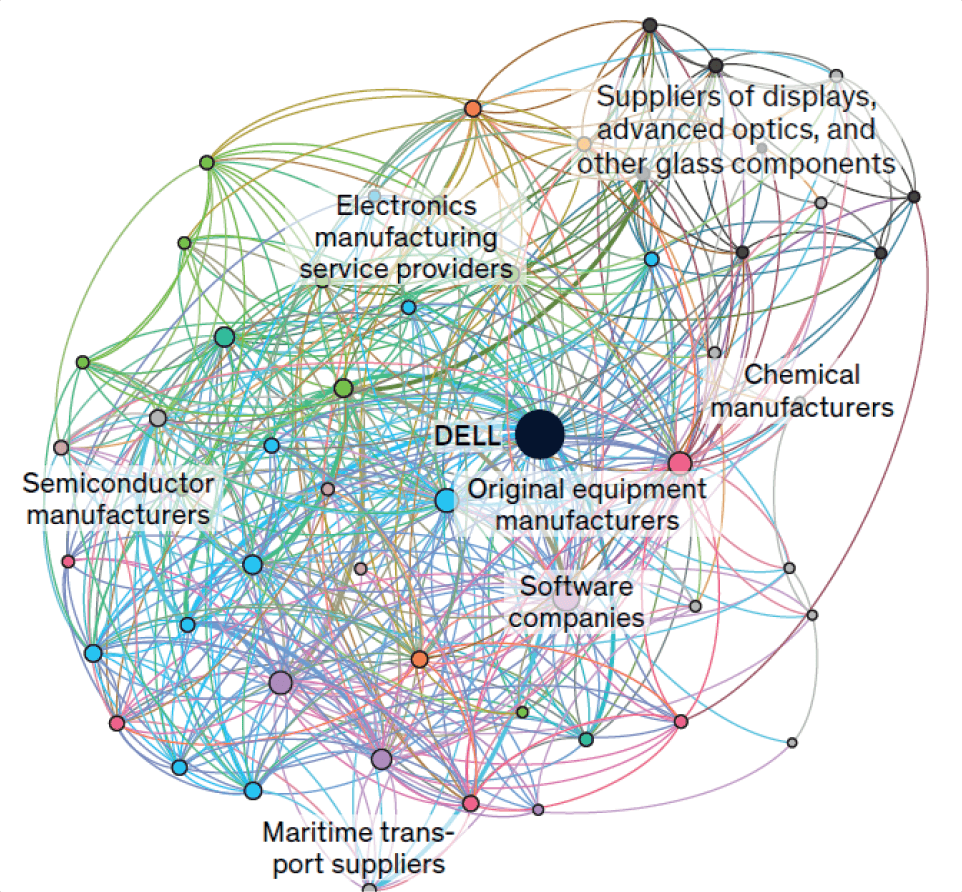
FinNet v0.1.1: Provides classes, methods. and functions to build and manipulate financial networks that include multiple types of relationships including ownership, board interlocks and legal entities. Look here for detailed information.
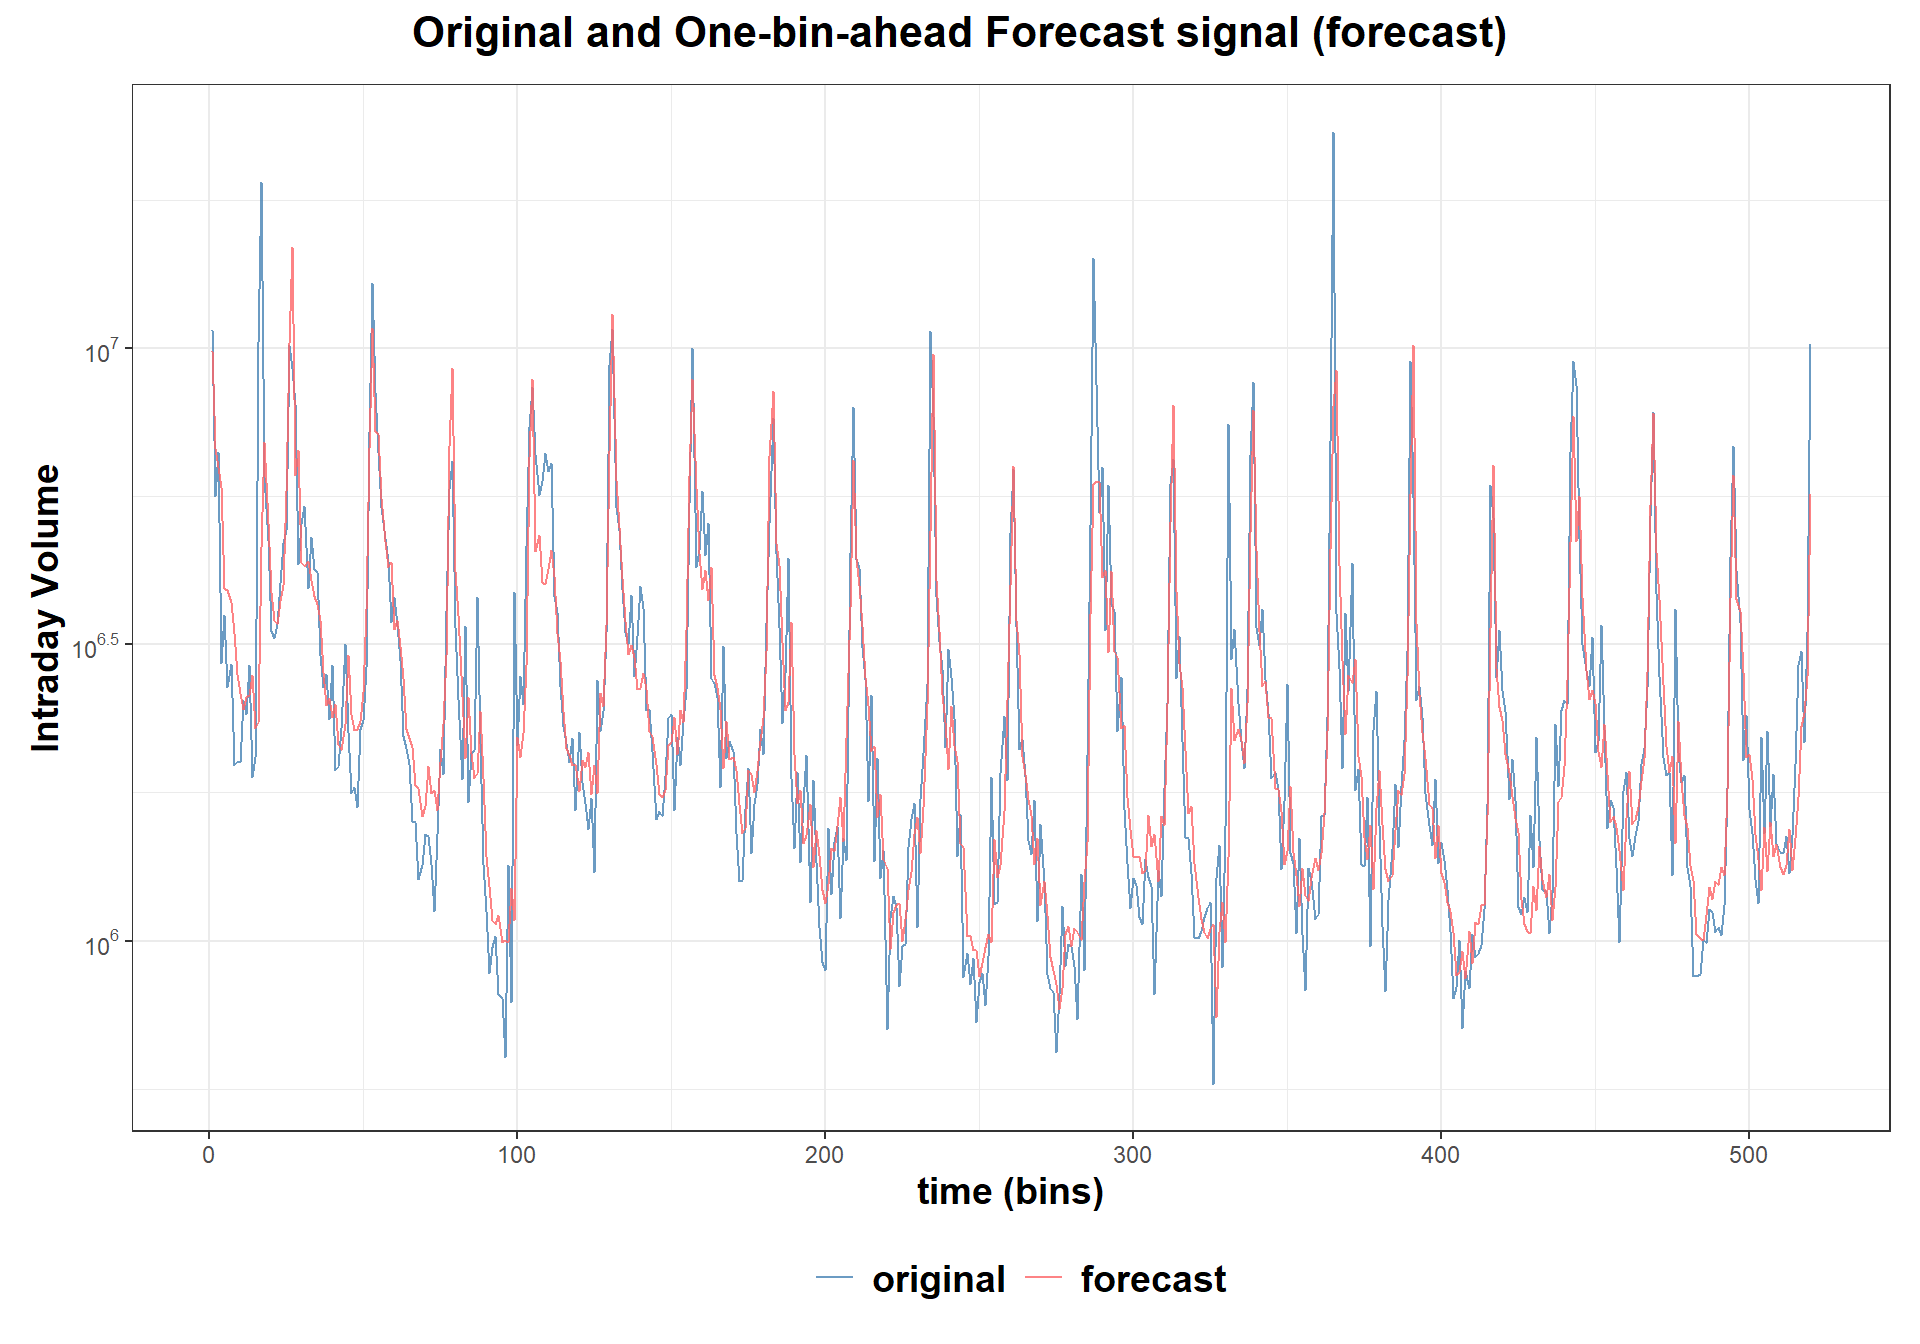
intradayModel v0.0.1: Provides functions to model, analyze, and forecast intraday signals via a univariate state-space model for intraday trading volume provided by Chen (2016). See the vignette.
StockDistFit v1.0.0: Provides functions for fitting probability distributions to stock price data using maximum likelihood estimation to find the best-fitting distribution for a given stock. See Siew et al. (2008) for background and the vignette for details.
Genomics
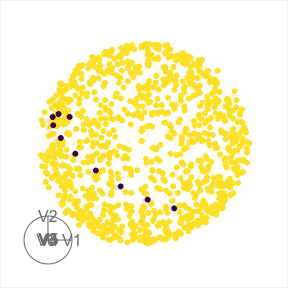
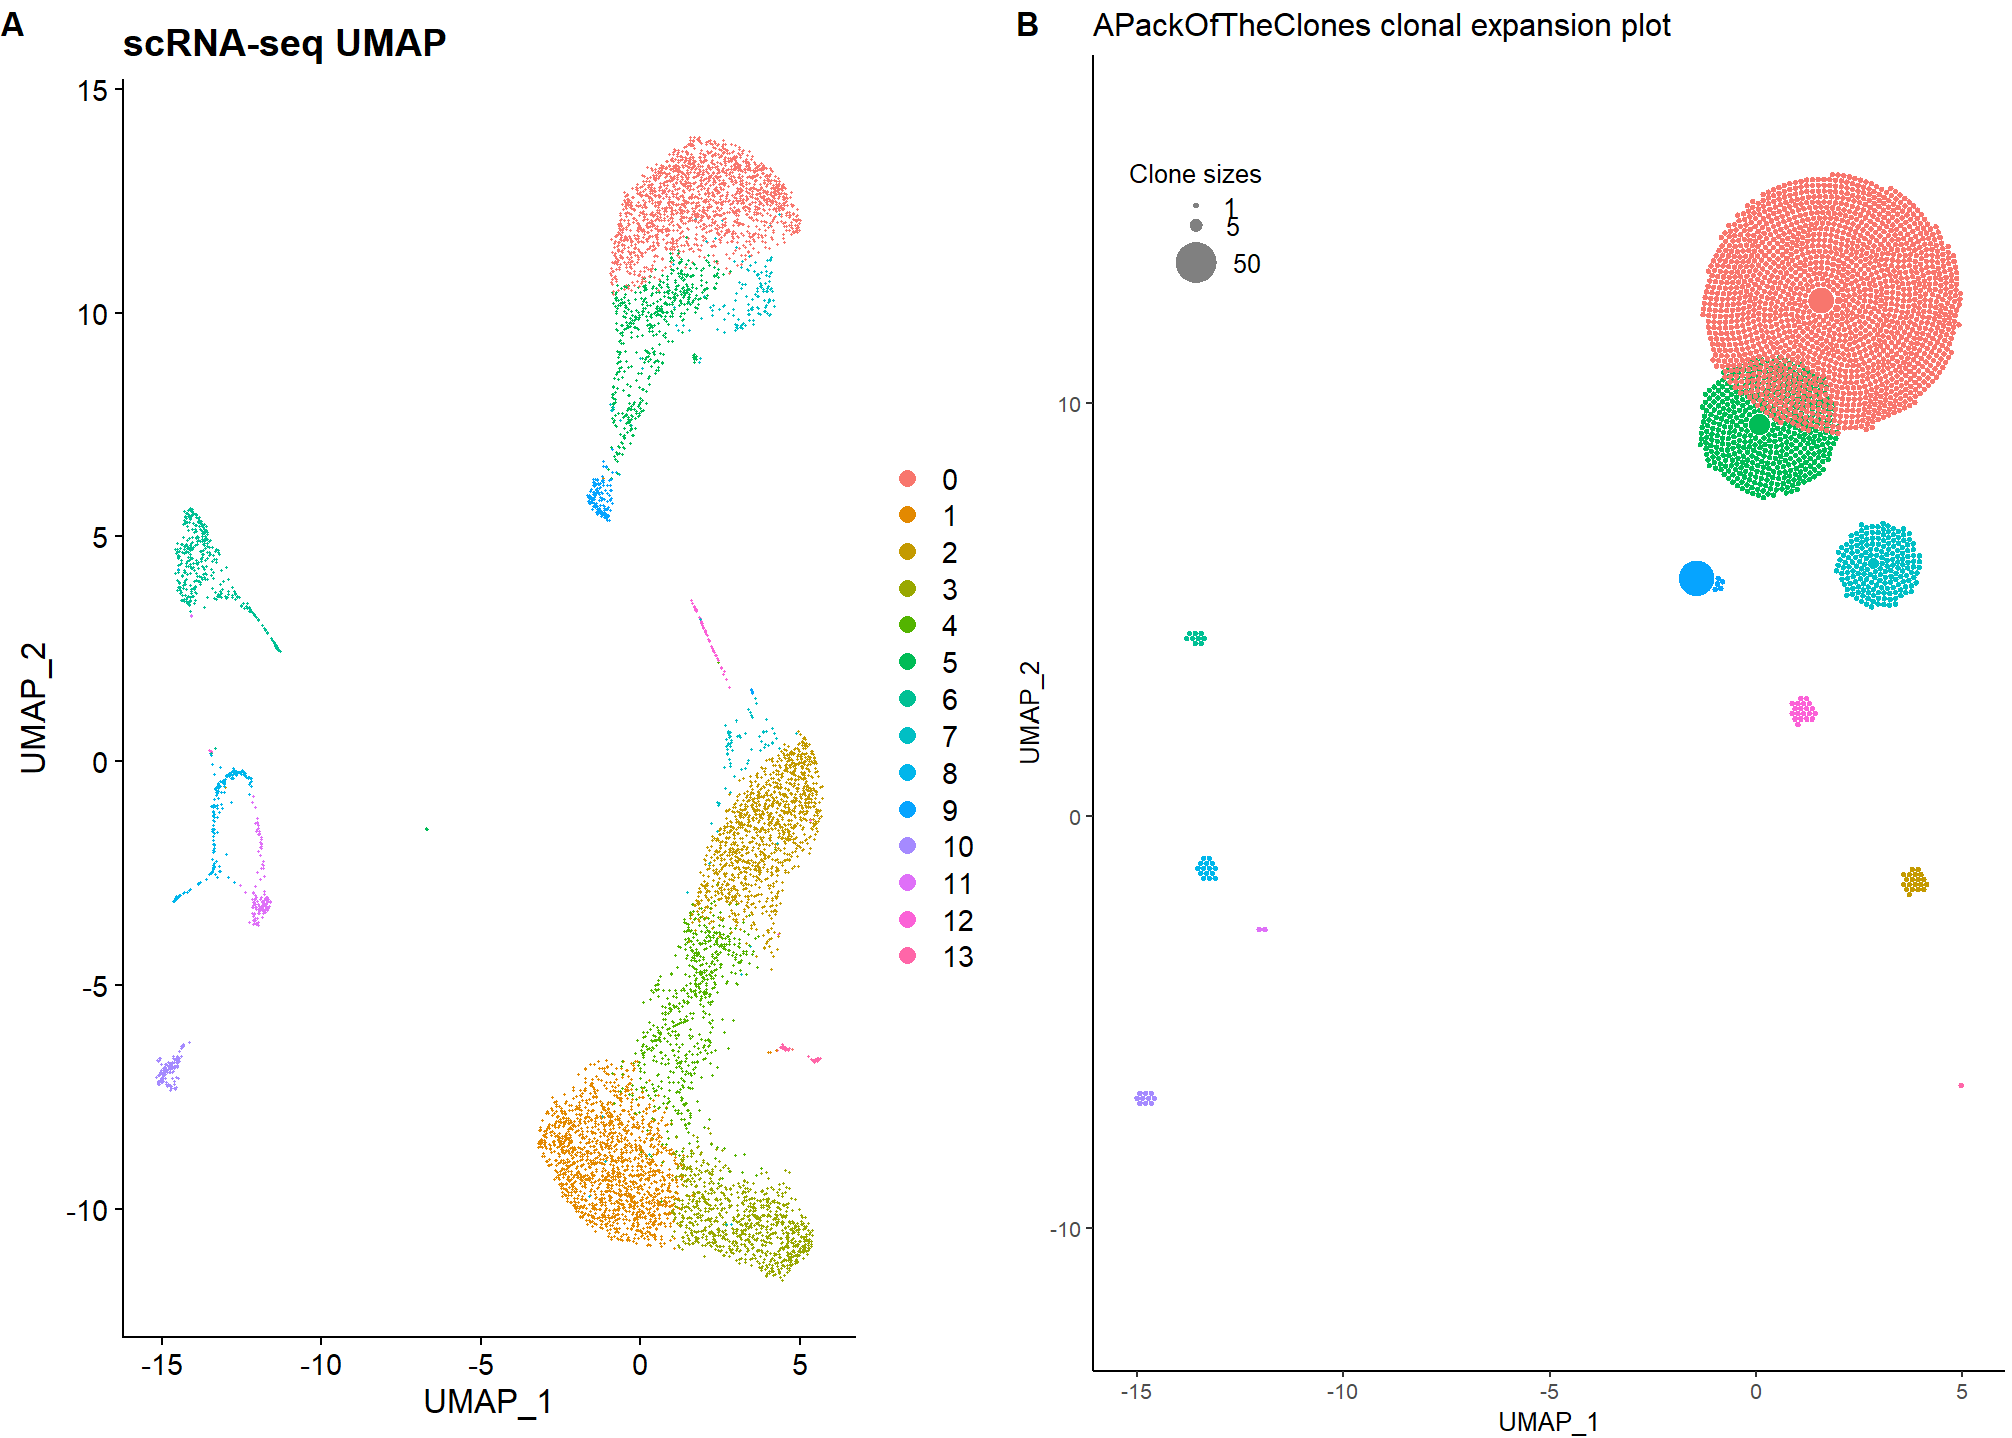
ApackOfTheCLones v0.1.2: Provides functions to visualize T-cell clonal expansion via circle-packing that can integrate single-cell RNA sequencing and T-cell receptor libraries from the 10X genomics Single Cell Immune Profiling and Cell Ranger pipeline, to produce a simple, publication-ready visualization of the clonal expansion. See README for examples.
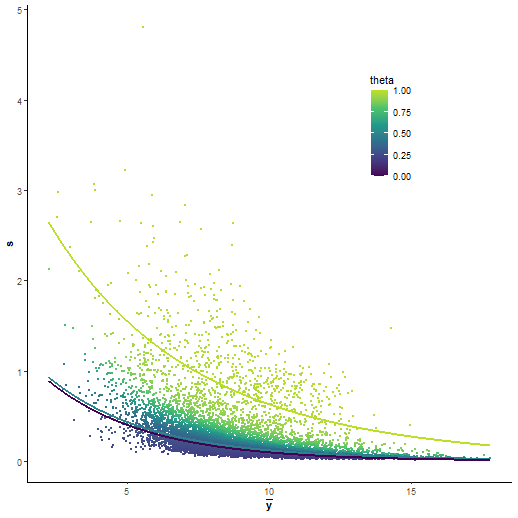
baldur v0.0.1: Implements a hierarchical Bayesian model for statistical decisions in proteomics that includes two regression models for describing the mean-variance trend, a gamma regression or a latent gamma mixture regression. The regression model is then used as an Empirical Bayes estimator for the prior on the variance in a peptide. See Berg & Popescu (2023) for the theory and the UPS and Yeast tutorials.
Mathematics
resde v1.1: Implements maximum likelihood estimation for univariate reducible stochastic differential equation models for discrete, possibly noisy observations, not necessarily evenly spaced in time. See Garcia (2019) for the theory and the vignette for some math and examples.
Medicine
PatientProfiles v0.2.0: Provides methods to identify the characteristics of patients in data mapped to the Observational Medical Outcomes Partnership (OMOP) common data model. See the vignettes Get cohort intersections and Get cohort patients characteristics.
PANACEA v1.0.0: Provides a collection of personalized anti-cancer drug prioritization approaches utilizing network methods that utilize personalized “driverness” scores from driveR to rank drugs and map them onto a protein-protein interaction network. See the vignette to get started.
Statistics
boostingDEA v0.1.0: Provides functions to estimate the production frontier and predict ideal output in the Data Envelopment Analysis (DEA) context using both standard models from DEA and Free Disposal Hull (FDH) and boosting techniques. See Guillen et al. (2023) for background and the vignette for examples.
gFormulaMI v1.0.0: Implements the G-Formula method for causal inference with time-varying treatments and confounders using Bayesian multiple imputation methods, as described by Bartlett et al. (2023). See the vignette.
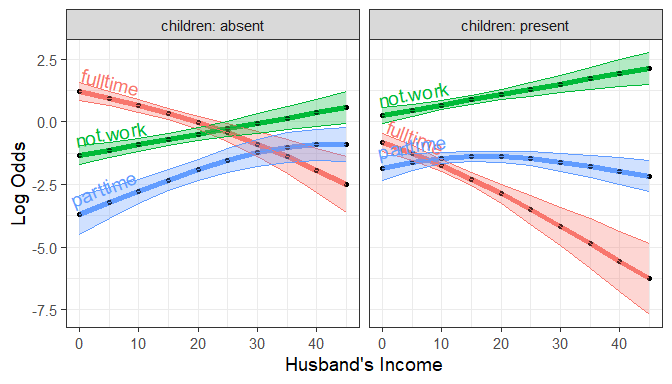
nestedLogit v0.3.2: Provides functions for specifying and fitting nested dichotomy logistic regression models for a multi-category response, and methods for summarizing and plotting those models. There are vignettes on Nested dichotomies Logit models, Plotting, and Standard Errors.
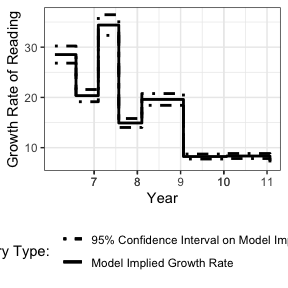
nlpsem v0.1.1: Provides computational tools for intrinsically nonlinear longitudinal models in multiple scenarios including multivariate models with time varying covariates, latent class, and a goal to assess correlation or causation among multiple longitudinal variables. Liu (2023) elaborates on the details. The vignettes provide examples for Latent Change Score Models, Latent Growth Curve Models, Multivariate Longitudinal Models, Longitudinal Mixture Models, Longitudinal Mediation Models, and Time-varying Covariate Models.
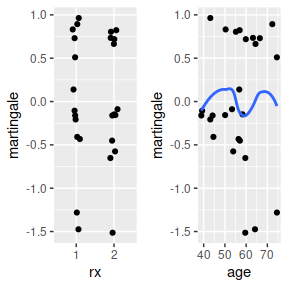
npcurePK v1.0-2: Provides functions to perform nonparametric estimation in mixture cure models when the cure status is partially known. See Safari et al. (2021), Safari et al. (2022), and Safari et al. (2023) and the vignette for an example.
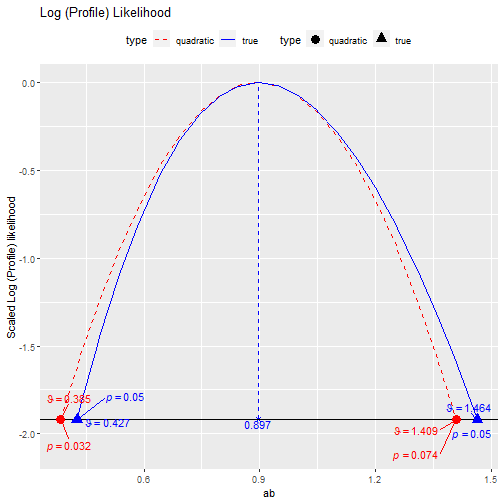
semlbci v0.10.3: Implements likelihood-based confidence intervals for parameters in structural equation modeling. See Cheung and Pesigan (2023), Pek and Wu (2018), and Falk (2018) for details. There are vignettes: Get Started, Log Profile Likelihood of a Parameter, and Searching for One Bound.
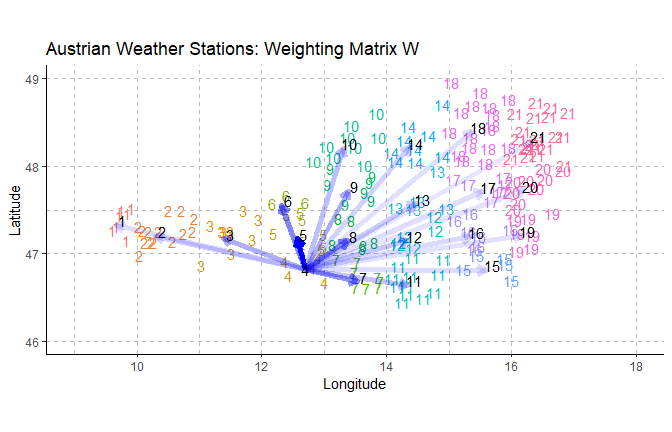
ssMRCD v0.1.0: Provides functions to estimate the Spatially Smoothed Minimum Regularized Determinant (ssMRCD) estimator and use it for outlier detection as described in Puchhammer and Filzmoser (2023) See the Introduction.
survstan v0.0.2: Implements parametric survival regression models under the maximum likelihood approach via Stan including accelerated failure time models, proportional hazards models, proportional odds models, accelerated hazard models, and Yang and Prentice models. See Bennett (1982, Chen and Wang(2000), Demarqui and Mayrink (2021) for background, README for some math, and the vignette for an example.
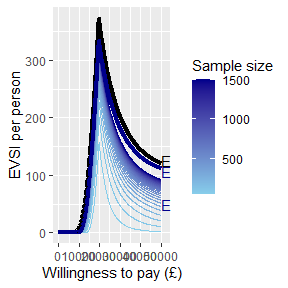
voi v1.0: Implements methods to calculate the expected value of information from a decision-analytic model. See Jackson et al. (2022) for the theory, the Package Overview and the vignette on Plots.
Utilities
crc32c v0.0.2: Implements hardware-based support for CRC32C cyclic redundancy checksum function for x86_64 systems with SSE2 support as well as for the arm64. The functionality is exported at the C-language level for use by other packages. See README for some background.
glossary v1.0.0: Implements tools to add glossaries to markdown and quarto documents by tagging individual words. Definitions can be provided inline or in a separate file. See the vignette.
iterors v1.0: Attempts to improve the performance of iterators in R. The package is cross-compatible with iterators and includes a collection of iterator constructors and combinators ported and refined from the iterators, itertools, and itertools2 packages. There are several vignettes including an Introduction, a Guide on using the package, and a vignette on Writing Custom Iterators..
rebib v0.2.2: Implements tools to convert embedded LaTeX bibliographies into a close BibTeX equivalent that is useful for web publishing systems (such as the R Journal) that do not support embedded bibliographies. See the Introduction and the vignettes general usage, parser mechanics, and use with RJ article.

sasr v0.1.2: Provides a SAS interface that enables creating SAS sessions, executing SAScode on remote SAS servers, exchanging data sets between SAS and R and more. See the vignette.
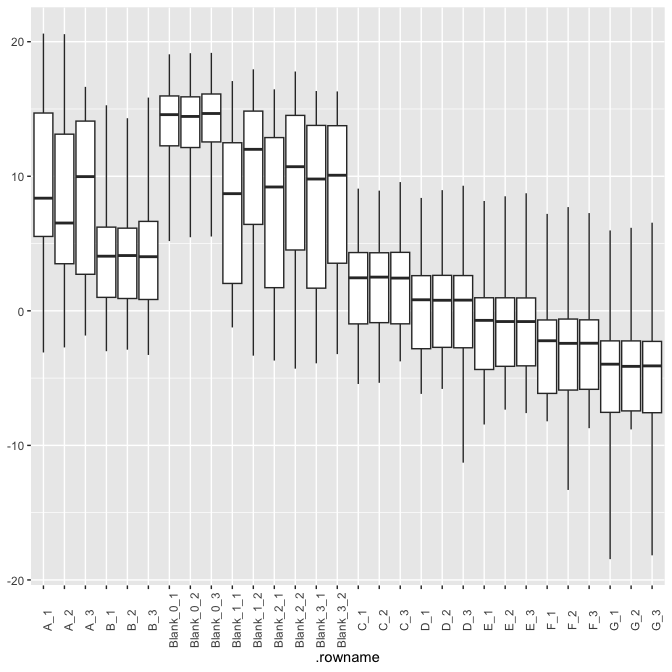
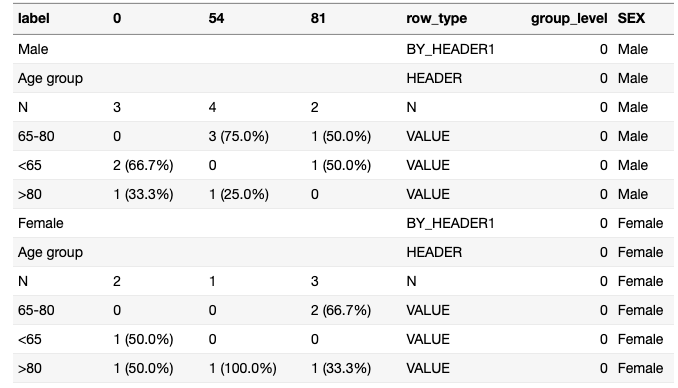
tidytlg v0.1.2: Implements tools to generate tables, listings, and graphs (TLG) using the tidyverse. Tables can be created functionally, using a standard process, or by specifying table and column metadata to create generic analysis summaries. There are several vignettes including examples for Freauency Analysis, Table Manipulation, and a Get Started guide.
Visualization
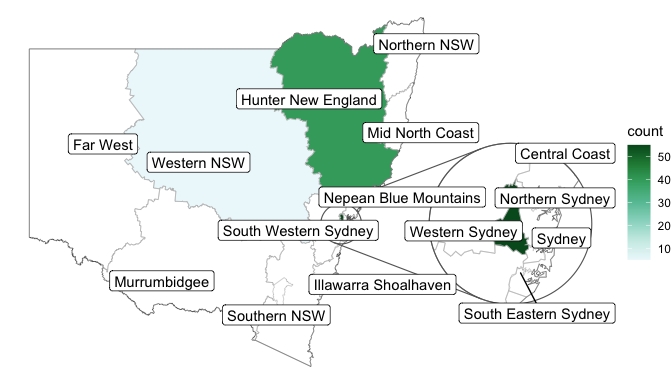
ggautomap v0.3.2: Extends ggplot2 to convert place names to coordinates without having to work directly with the underlying geospatial tools. See the Getting Started Guide.
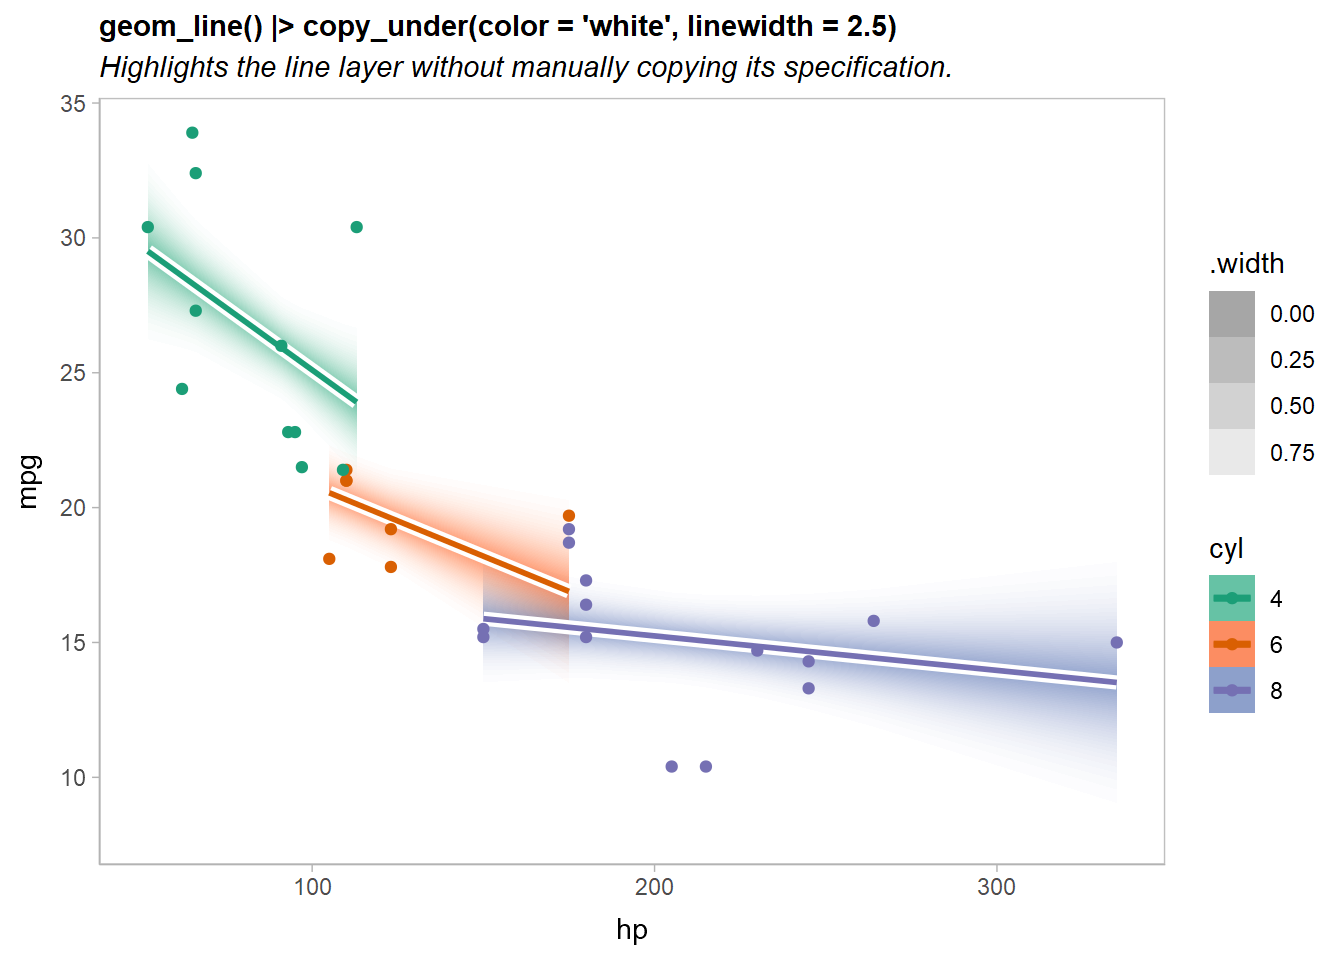
ggplend v0.1.0: v0.1.0: Implements an algebra of operations for blending, copying, adjusting, and compositing layers in ggplot2 that supports copying and adjusting the aesthetics or parameters of an existing layer, partitioning a layer into multiple pieces for re-composition, applying affine transformations to layers, and combining layers. See README for examples.
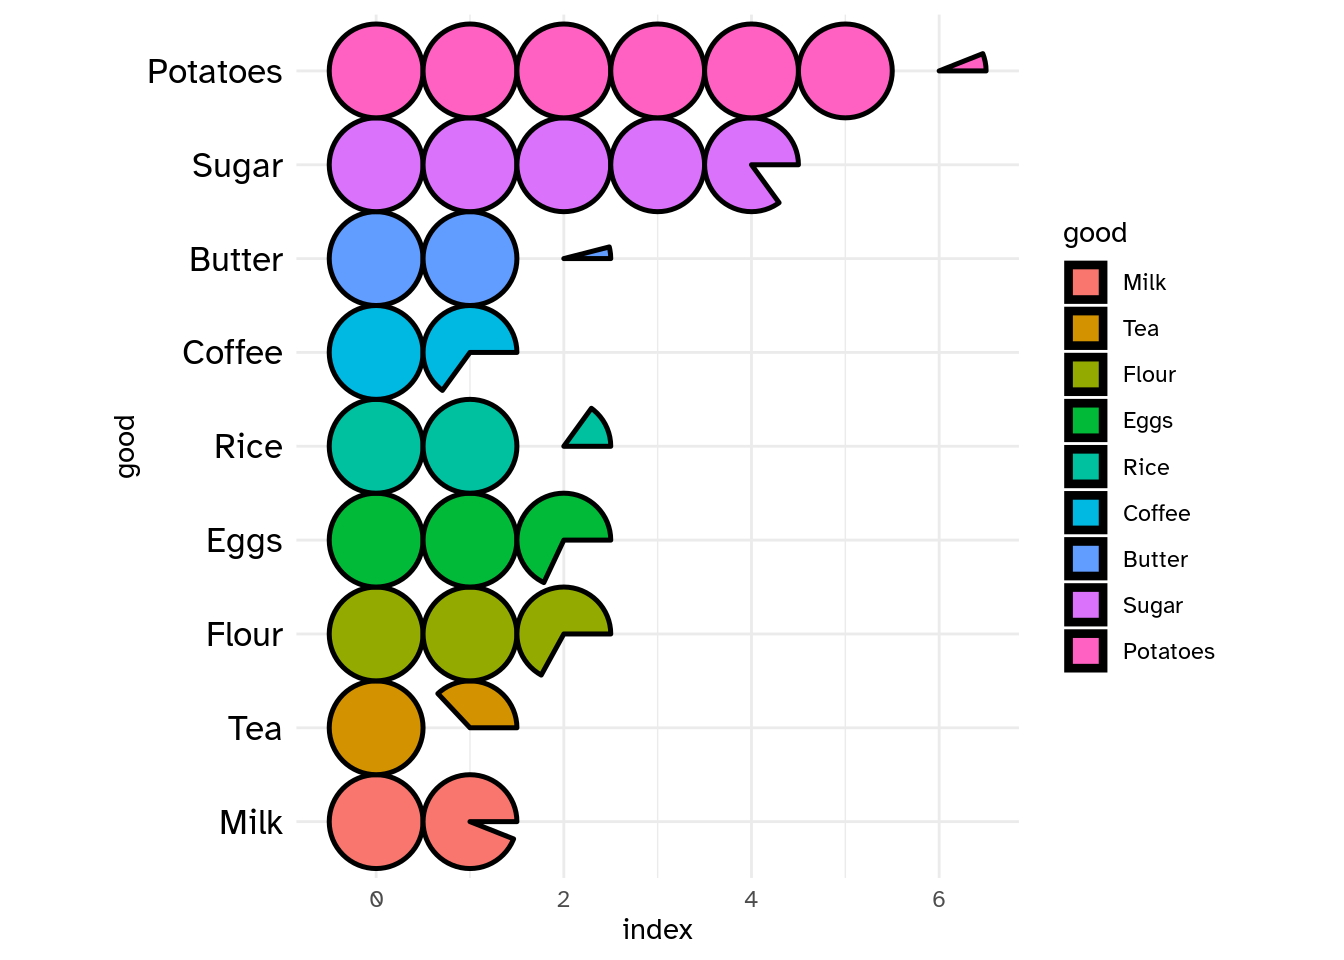
ggtricks v0.1.0: Provides collection of ggplot2() geoms to create graphics using Cartesian coordinate system and avoid the use of polar coordinates. Look here for examples.
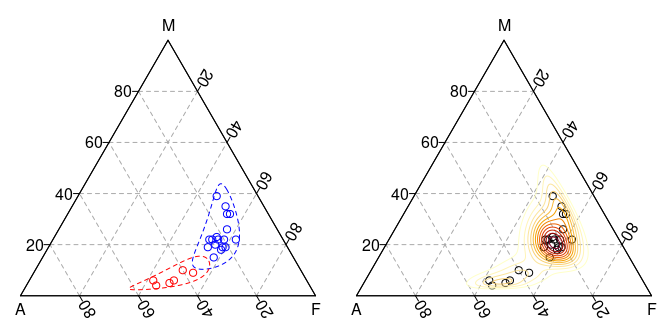
isopleuros v1.0.0: Provides functions to display data in ternary space, to add or tune graphical elements and to display statistical summaries. It also includes common ternary diagrams which are useful for archaeologists. See README for examples.
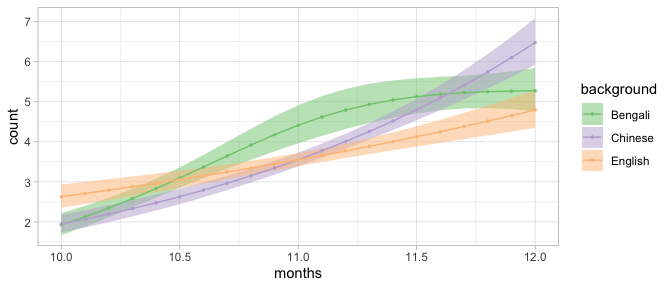
tidygam v0.2.0: Provides functions that compute predictions from Generalized Additive Models (GAMs) fitted with mgcv and return them as a tibble. See the vignette to get started.
You may leave a comment below or discuss the post in the forum community.rstudio.com.