One hundred and fifty-one new packages arrived at CRAN in February. Here are my “Top 40” picks organized into eight categories: Bioinformatics, Data, Machine Learning, Medicine, Statistics, Time Series, Utilities and Visualization.
Bioinfomatics
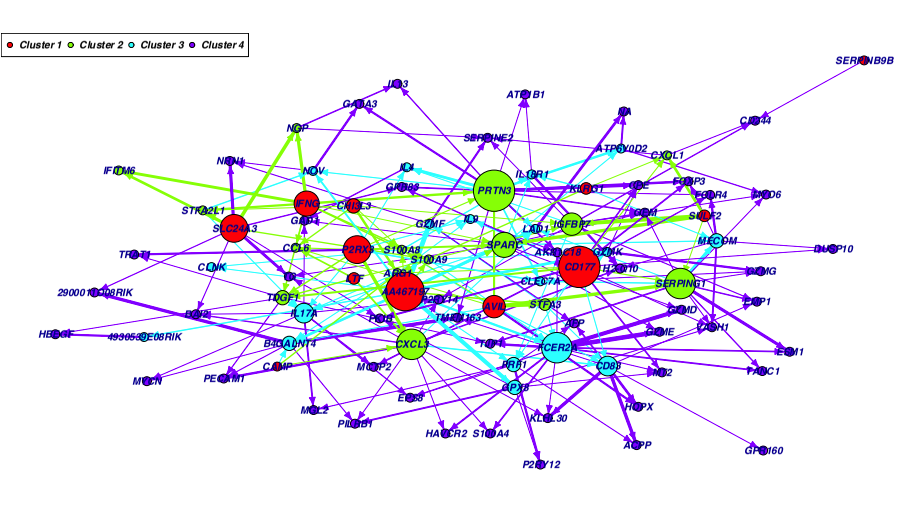
Cascade v1.7: Implements a modeling tool allowing gene selection, reverse engineering, and prediction in cascade networks. See Jung et al. (2014) for details, along with a Package Introduction and a vignette on re-analysis.
countfitteR v1.0: Implements functions and a Shiny app for the automatized evaluation of distribution models for count data with an eye towards use in DNA analyses. The vignette provides an overview.
Data
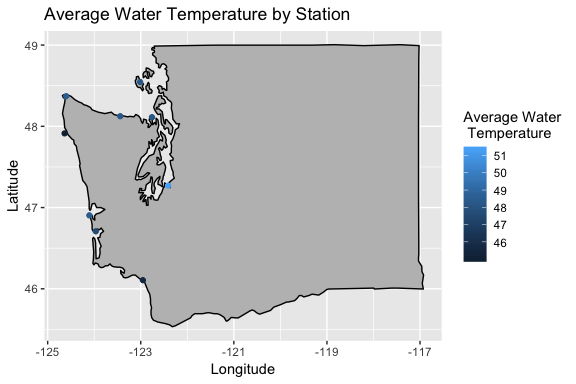
noaaoceans v0.1.0: Provides tools to access the National Oceanic and Atmospheric Administration (NOAA) API. See the vignette for details.
guardianapi v0.1.0: Provides functions to access to The Guardian’s open API, containing all articles published in ‘The Guardian’ from 1999 to the present. The vignette shows how to use the package.
RobinHood v:1.0.1: Implements an interface to the RobinHood investing platform, including the ability to access account data, retrieve investment statistics and quotes, place and cancel orders, and more.
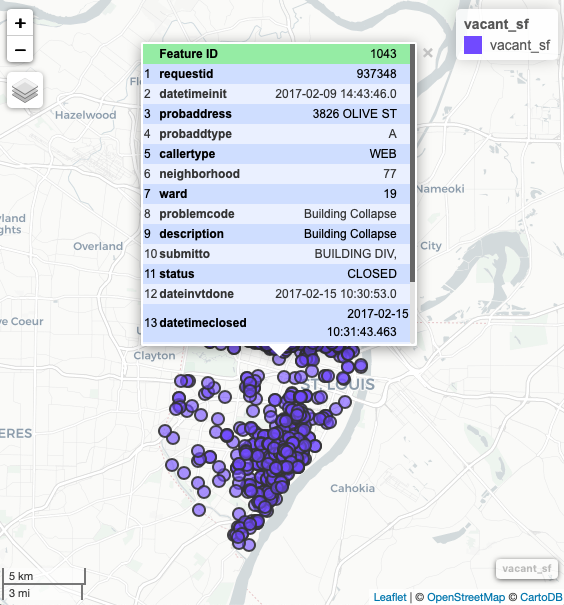
stlcsb v0.1.2: Provides functions working with data from The Citizens’ Service Bureau of the City of St. Louis including downloading data, categorizing problem requests, cleaning and subsetting CSB data, and projecting the data using the x and y coordinates. See the vignette.
Machine Learning
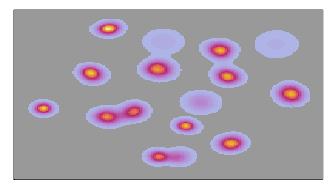
bigMap v2.1.0: Implements an unsupervised clustering protocol for large scale structured data, based on a low dimensional representation of the data. See Garriga and Bartumeus (2018) and the vignette for details.
fastNaiveBayes v1.0.1: Provides an extremely fast implementation of a Naive Bayes classifier that is largely based on the paper Schneider (2003). See the vignette for an introduction.
gama v1.0.3: Implements a genetic, evolutionary approach to performing hard partitional clustering. For details see Scrucca (2013), Charrad et al. (2014), and Tsagris and Papadakis (2018). The vignette shows how to use the package.
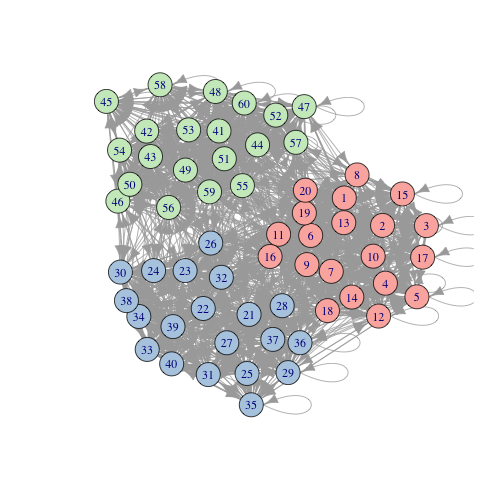
leiden v0.2.3: Uses reticulate to implement the Python leidenalg clustering algorithm for partitioning graphs in to communities in R. See the Python repository and Traag et al (2018) for details. There is also a vignette.
r.blip v1.1: Provides functions to learn Bayesian networks from datasets containing thousands of variables, and includes algorithms for (1) parent set identification (Scanagatta (2015)), (2) general structure optimization (Scanagatta (2018)), (3) bounded tree width structure optimization (Scanagatta (2016)), and (4) structure learning on incomplete data sets (Scanagatta (2018)).
RTML v0.9: Implements efficient solvers for 10 regularized multi-task learning algorithms applicable for regression, classification, joint feature selection, task clustering, low-rank learning, sparse learning and network incorporation. The details are described Cao and Schwarz (2018). There is a Tutorial.
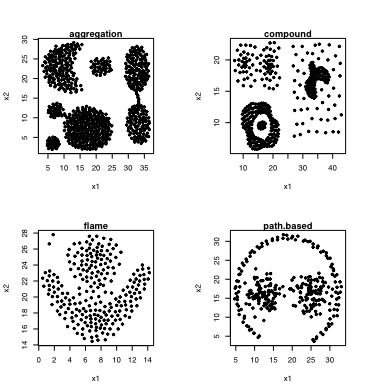
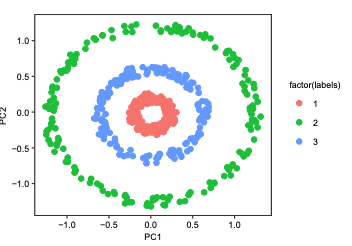
Spectrum v0.4: Implements a fast, adaptive spectral clustering algorithm for single and multi-view data. The vignette provides an introduction.
SAR v1.0.0: Provides both a stand-alone and Azure Cloud implementation of the Smart Adaptive Recommendations (SAR) algorithm for personalized recommendations. Look here for a description of the SAR algorithm.
tfdeploy v0.6.0: Provides tools to deploy TensorFlow models across several services. There is a vignette of Deploying TensorFlow Models and another for using Saved Models.
tfio v0.4.0: Provides an interface to TensorFlow IO. There is a brief Introduction.
stabm v1.0.0: Implements several measures for the assessment of the stability of feature selection. See Bommert et al. (2017).
tidystopwords 0.9.0: Provides functions to generate stopword lists in 53 languages, in a way consistent across all the languages supported. There is a vignette.
Medicine
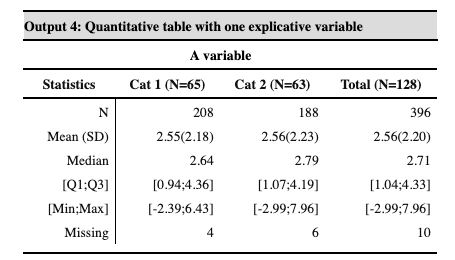
ClinReport v0.9.1.11: Provides functions to create formatted statistical tables in Microsoft Word documents that meet clinical standards. There is a vignette for Getting Started, a vignette for Modifying Outputs, and another for Graphic Outputs.
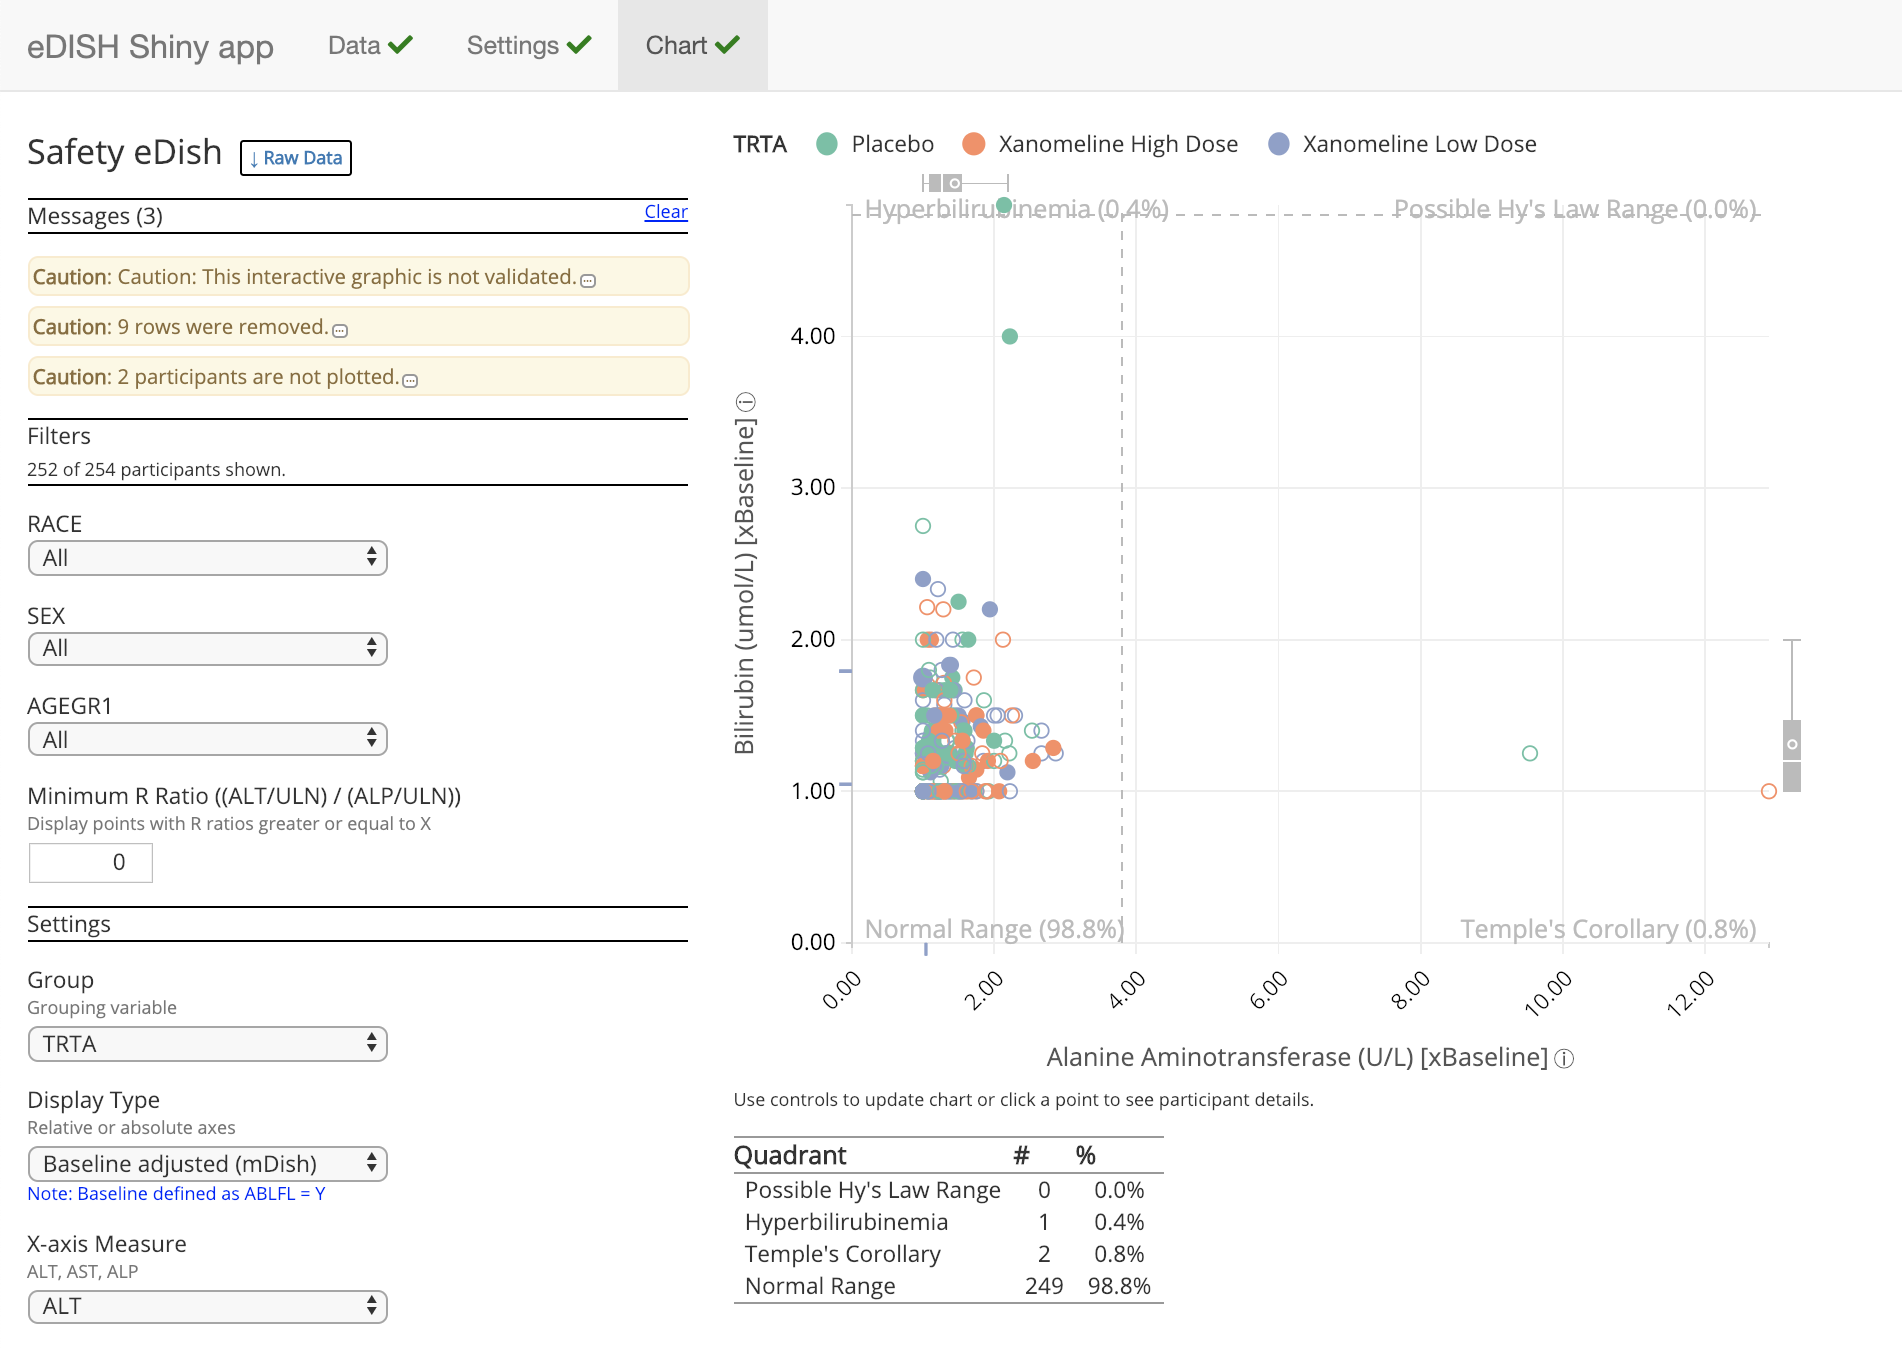
safetyGraphics v0.7.3: Implements a framework for evaluation of clinical trial safety through a Shiny application or standalone htmlwidget charts. See the User Guide.
Statistics
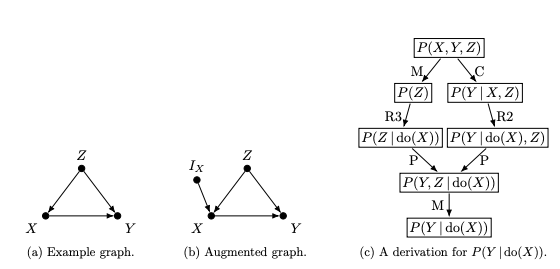
dosearch v1.0.2: Implements a method to identify causal effects from arbitrary observational and experimental probability distributions via do-calculus and standard probability manipulations, using a search-based algorithm that handles selection bias (Bareinboim and Tian (2015)), transportability (Bareinboim and Pearl (2014)), missing data (Mohan et al. (2013)), and arbitrary combinations of these. There is an informative Introduction
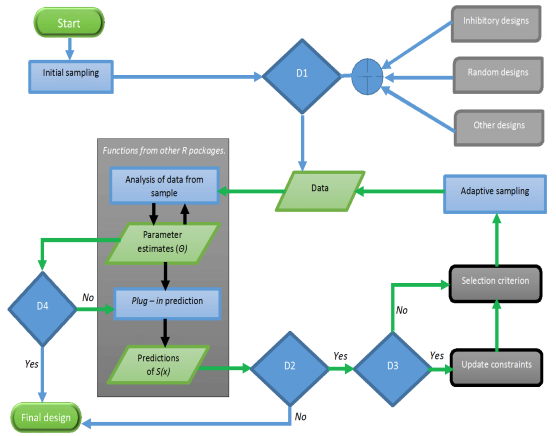
geosample v0.2.1: Provides functions for constructing sampling designs. For details, see Chipeta et al. (2016) and the vignette.
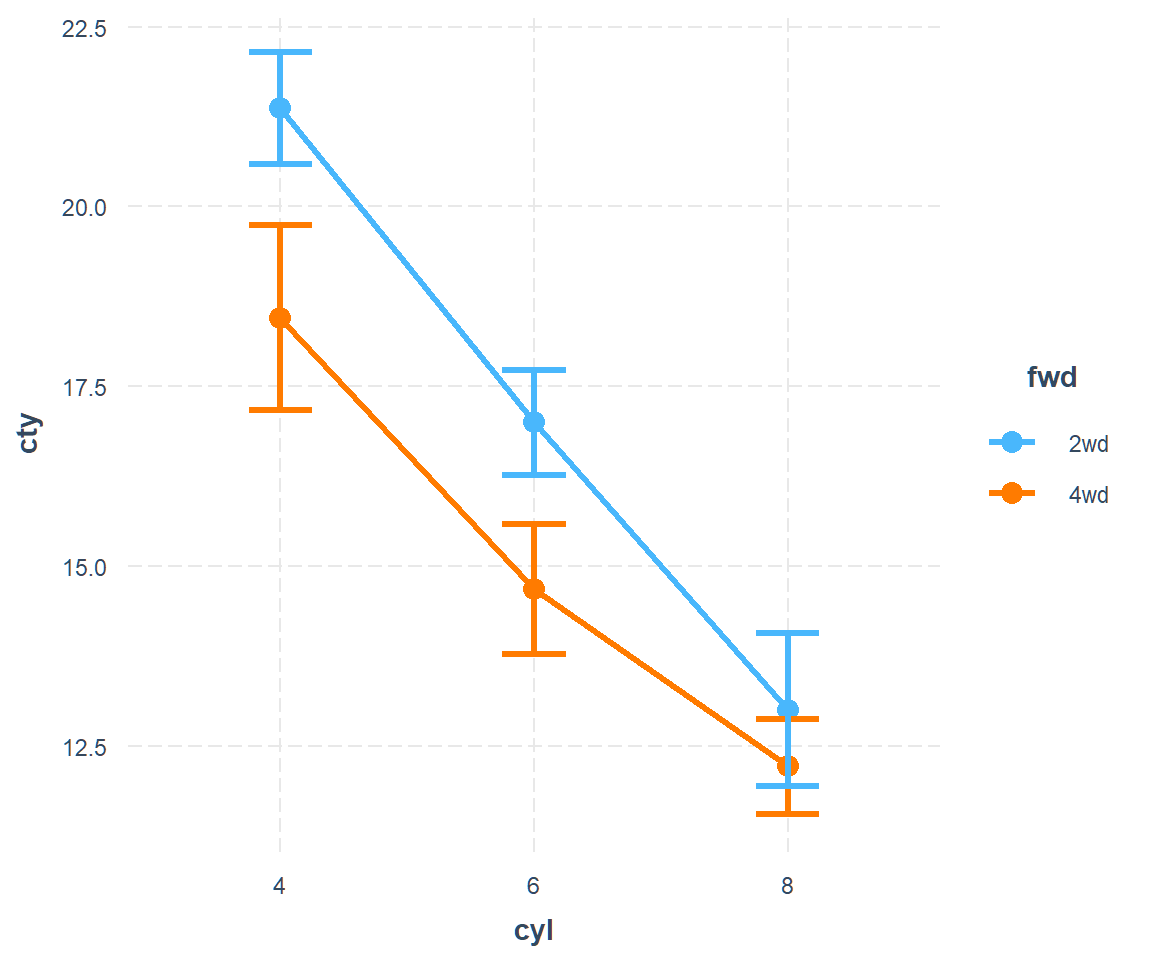
interactions v1.0.0: Provides a suite of functions for conducting and interpreting the analysis of statistical interaction in regression models, and includes visualization of two- and three-way interactions. There is a vignette for Exploring Interactions and another for Plotting Interactions.
IrregLong v0.1.1: Provides functions to analyze longitudinal data for which the times of observation are random variables that are potentially associated with the outcome process, and includes inverse-intensity weighting methods (Lin et al. (2004)) and multiple outputation (Pullenayegum (2016)). Look here for an overview.
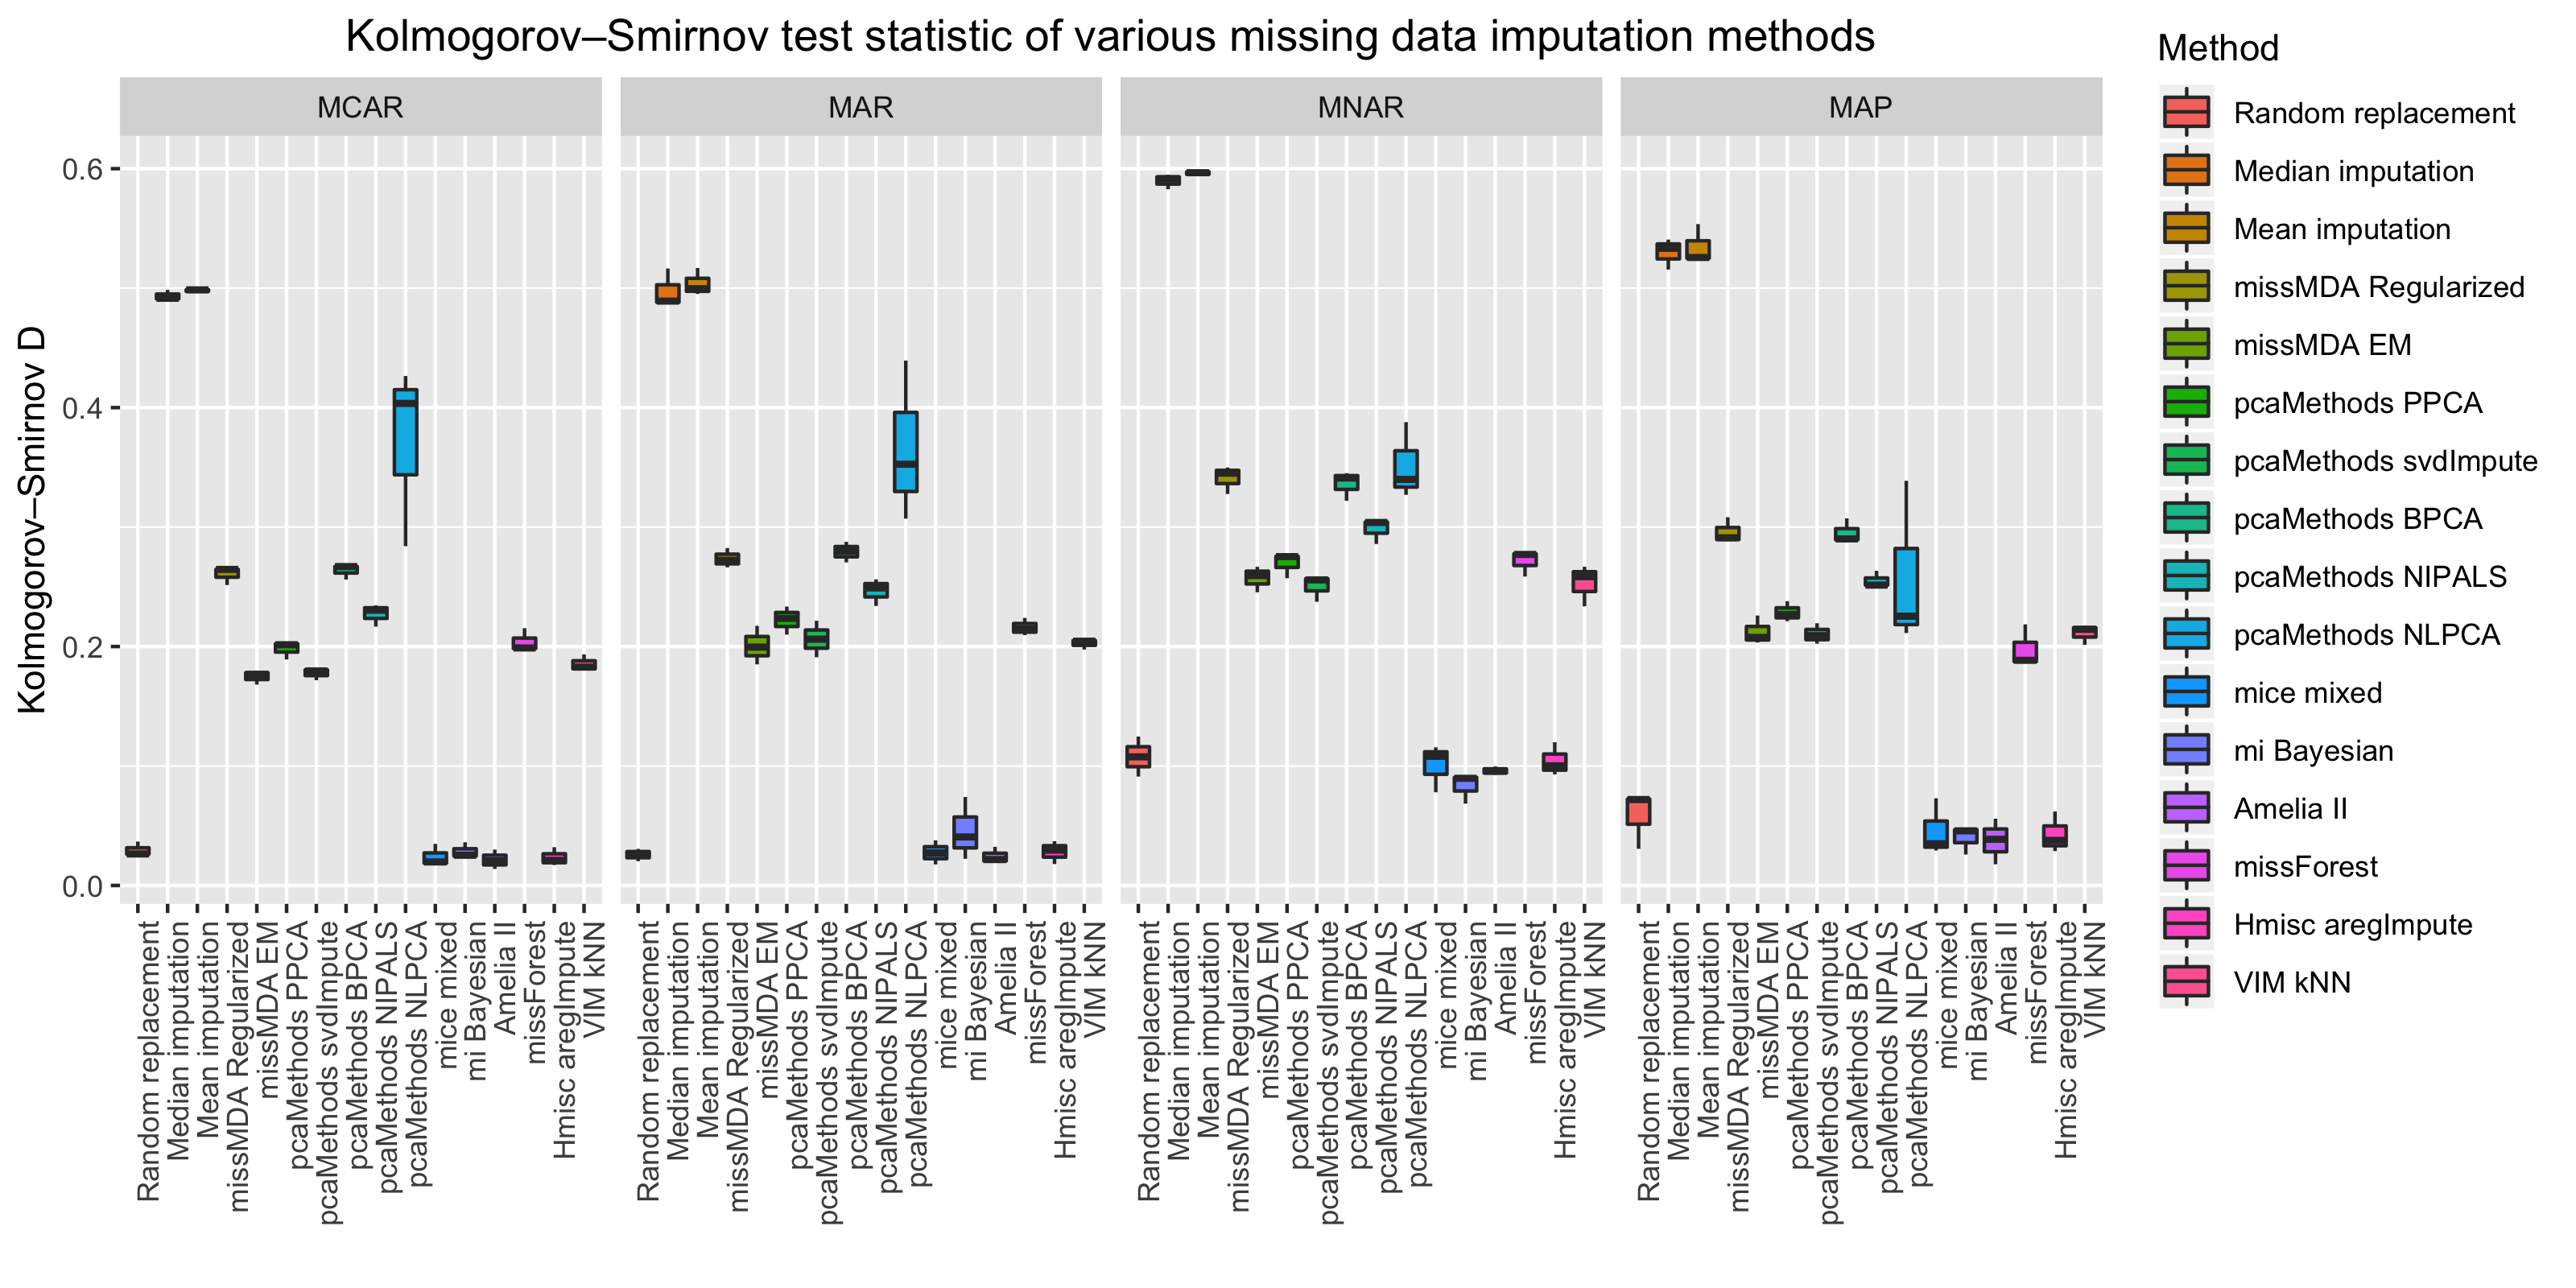
missCompare v1.0.1: Implements a pipeline to test and compare various missing data imputation algorithms on simulated and real data. There is a Tutorial.
OutlierDetection v0.1.0: Implements various methods to detect outliers including: model-based (Barnett (1978)), distance-based (Hautamaki et al. (2004)), dispersion-based (Jin et al. (2001)), depth-based (Johnson et al. (1998)), and density-based (Ester et al. (1996)).
plsr v0.0.1: Provides functions for the partial least squares analysis of the relation between two high-dimensional data sets. See McIntosh & Lobaugh (2004) and the vignette for more information.
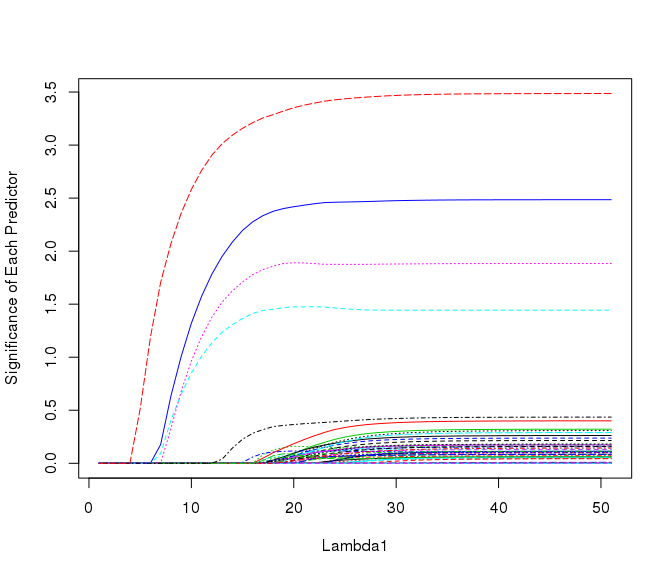
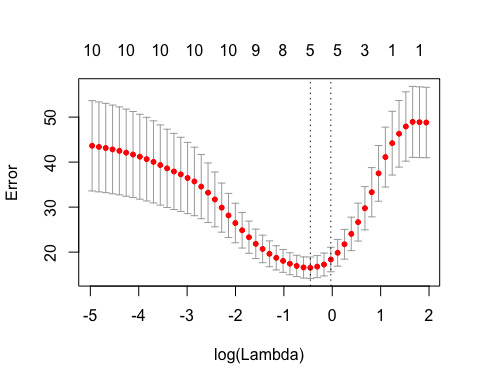
pliable v1.1: Fits a pliable lasso model. For details see Tibshirani and Friedman (2018) and the package vignette.
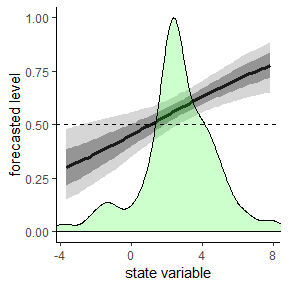
PointFore v0.2.0: Provides functions to estimate specification models for the state-dependent level of an optimal quantile/expectile forecast along with Wald Tests and a test of overidentifying restrictions. There is a Tutorial and vignettes on the GDP Greenbook and Preciptation examples.
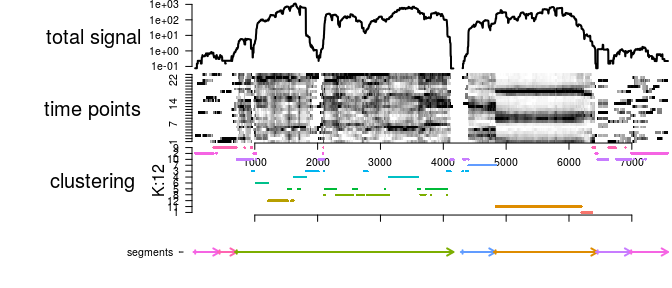
segmenTier v0.1.2: Implements a dynamic programming solution to segmentation based on maximization of arbitrary similarity measures within segments, based on the theory described in Machne et al. (2017). The vignette provides an Introduction.
TextForecast v0.1.1: Provides functions for regression analysis and forecasting using textual data, which are based on Lima (2018). The vignette shows how to use the package.
Time Series
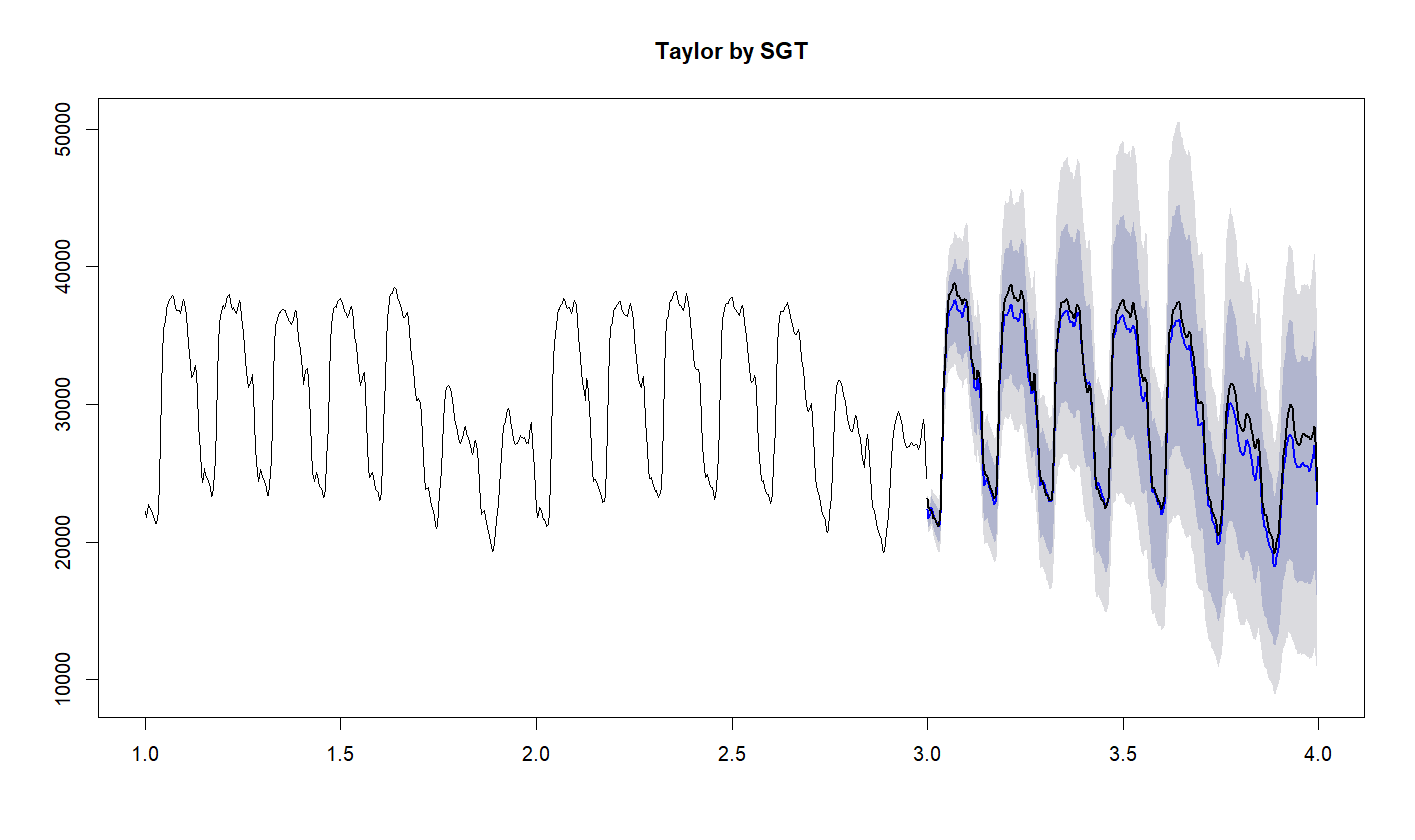
Rlgt v0.1-2: Provides functions to use rstan to fit several Global Trend models for time series forecasting that are Bayesian generalizations and extensions of some Exponential Smoothing models. There is an Intorduction to global trend time series forecasting and an Introduction to the package.
tsfeatures v1.0.0: Implements methods for extracting various features from time series data as described in Hyndman et al. (2013) , Kang et al.(2017) and Fulcher et al. (2013). The vignette contains examples.
Utilities
pak v0.1.2: Streamlines and improves package installation. See README.

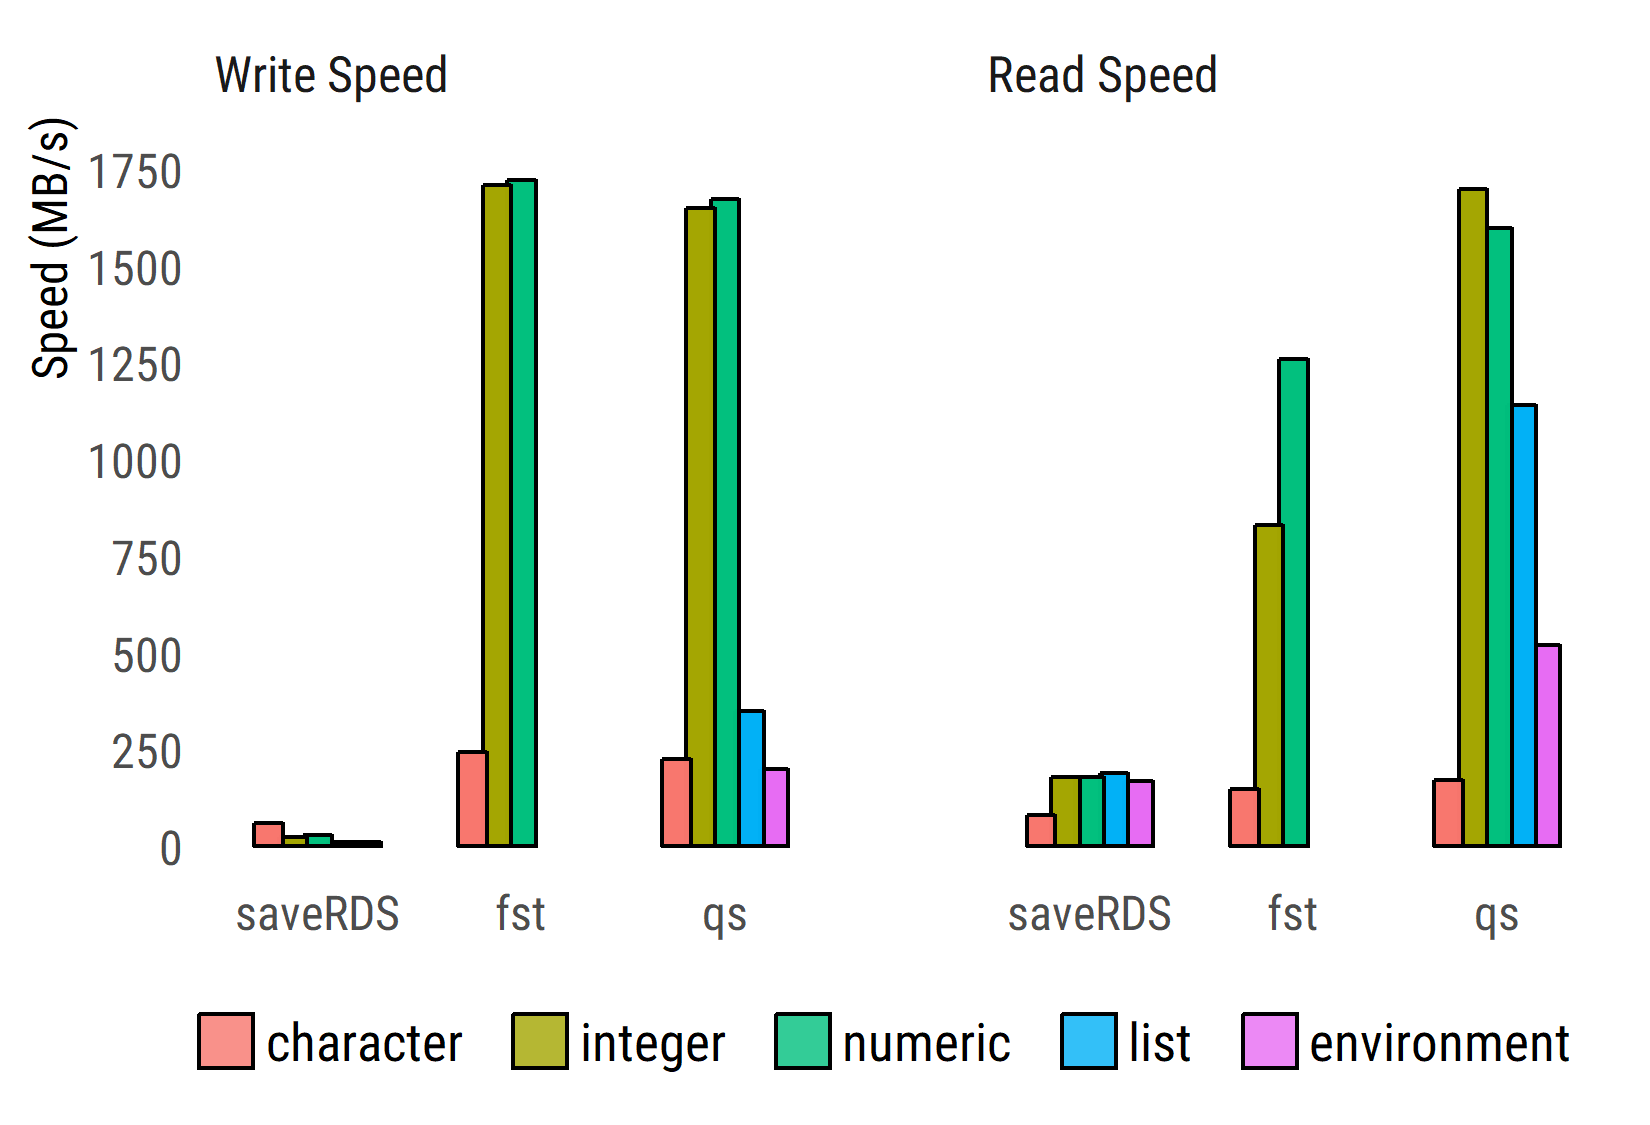
qs v0.14.1: Provides functions for quickly writing and reading any R object to and from disk. See the vignette for use and timings.
ropendata v0.1.0: Provides functions to collect cyber-security data and make it available via the Open Data portal. Look at README for information on using the package.
rosr v0.0.5: Provides methods to create reproducible academic projects with integrated academic elements, including datasets, references, codes, images, manuscripts, dissertations, slides and so on.
ShinyEventLogger v0.1.1: Implements a logging framework for complex Shiny apps. The vignette shows how to start logging.
Visualization
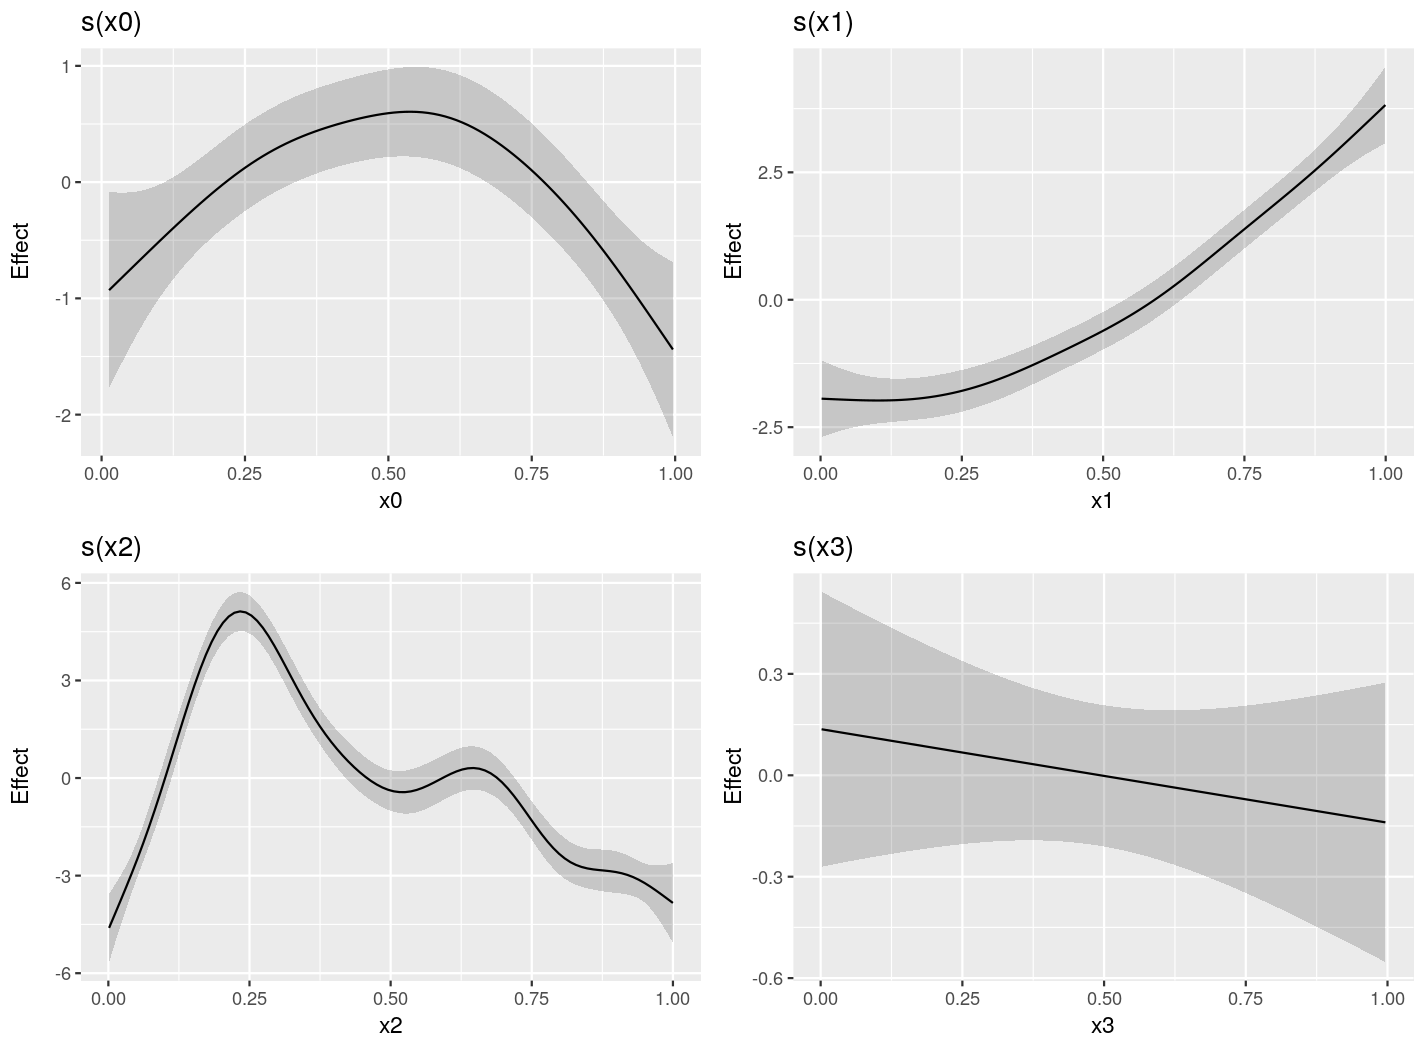
gratia v0.2-8: Provides graceful ggplot-based graphics and utility functions for working with generalized additive models (GAMs) fitted using the mgcv package. Look here for examples.
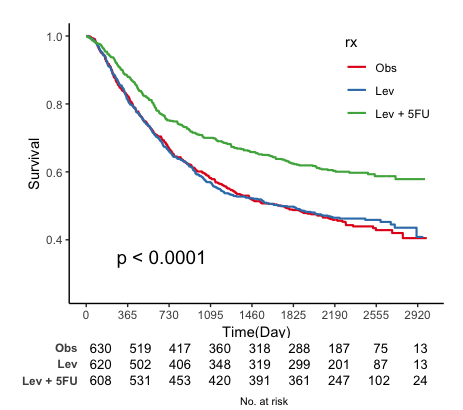
jskm v0.3.1: Provides the function jskm() to create publication quality Kaplan-Meier plots with at-risk tables below, and svyjskm() to plot a weighted Kaplan-Meier estimator.
You may leave a comment below or discuss the post in the forum community.rstudio.com.