One hundred sixty-seven new packages made it to CRAN in November: Here are my “Top 40” selections in fourteen categories: Climate Modeling: Computational Methods, Data, Ecology, Epidemiology, Genomics, Machine Learning, Mathematics, Networks, Pharma, Statistics, Time Series, Utilities, and Visualization.
Climate Modeling
gtfs2emis v0.1.0: Implements a bottom up model to estimate the emission levels of public transport systems based on General Transit Feed Specification data. Functions estimate several pollutants at high spatial and temporal resolutions. See Viera et al for background. There is a Getting Started Guide, and vignettes on Emission Factors and Preparing Data.
Computational Methods
jmatrix v1.1: A mainly instrumental package that allows other packages with cores written in C++ to read, write and manipulate matrices in a binary format to mitigate memory issues. See the vignette.
lazyNumbers v1.2.1: Implements lazy numbers, a new number type whose arithmetic is exact, contrary to ordinary floating-point arithmetic. The lazy numbers are implemented in C++ with the CGAL library. See README for examples.
miesmuschel v0.0.2: Provides optimization algorithms and functions that can be used to manually construct specialized optimization loops including the mixed integer evolution strategy as described in Li et al. (2013) and the multi-objective optimization algorithms NSGA-II described in Deb et al. (2002). See README for examples.
mlr3mbo v0.1.1: Implements a flexible approach to Bayesian optimization that includes both ready-to-use optimization algorithms as well as fundamental building blocks to construct custom algorithms. See Jones et al. (1998), Knowles (2006), and Ponweiser et al. (2008) for examples of ready to use optimization algorithms and the vignette for examples.
Data
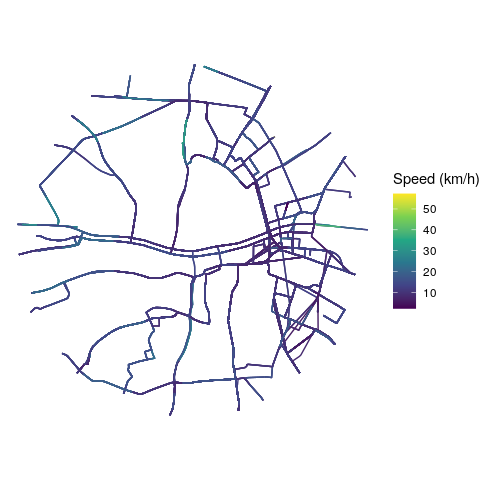
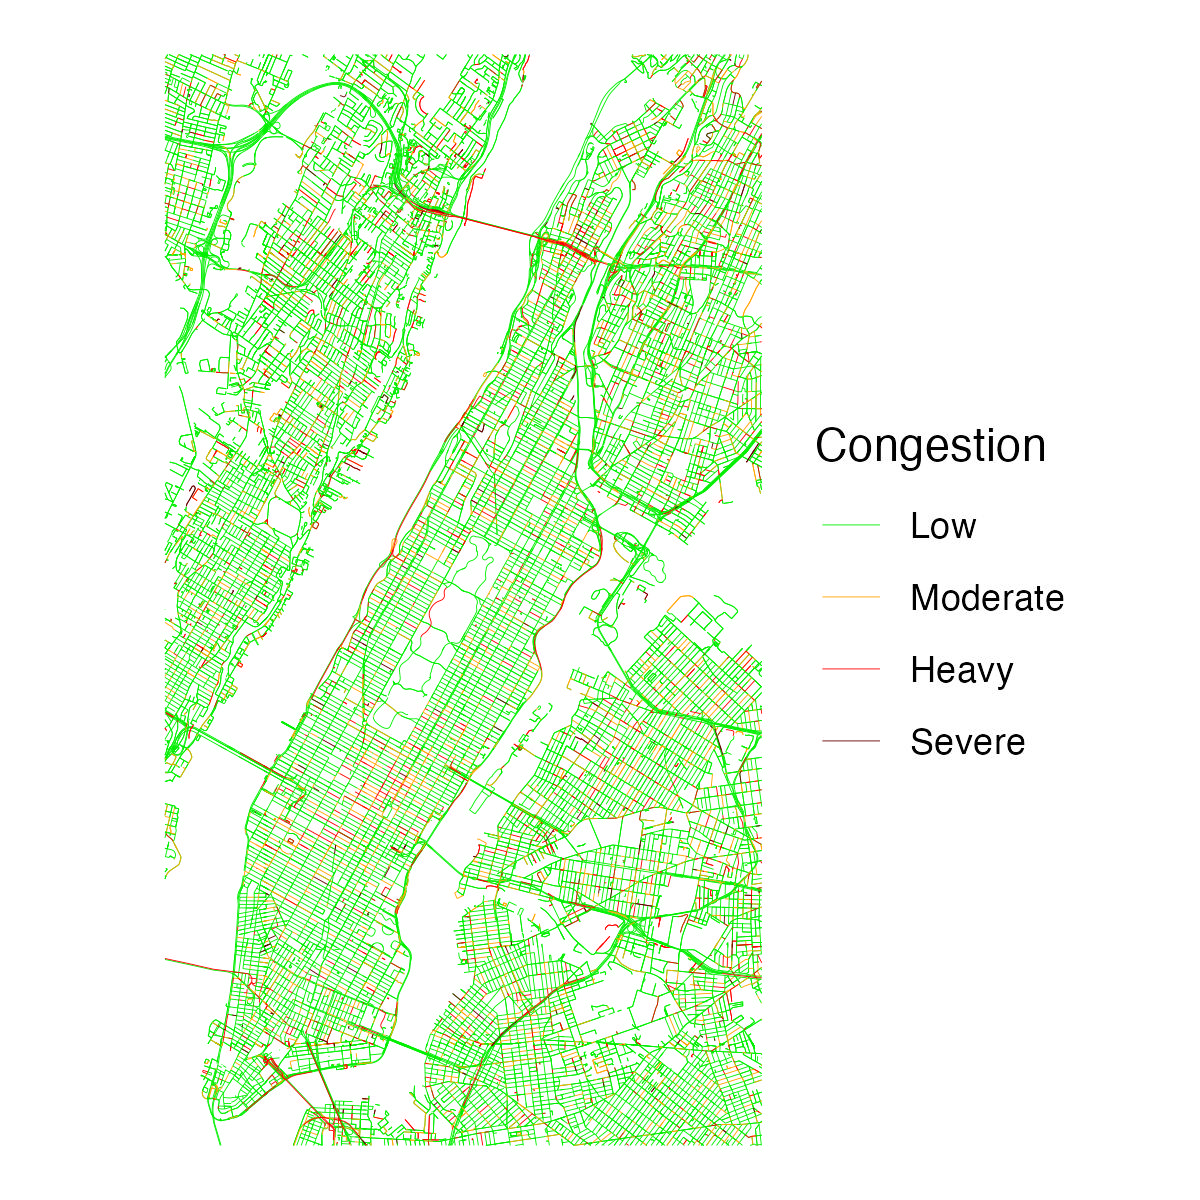
googletraffic v0.1.1: Allows users to create geographically referenced traffic data from the Google Maps JavaScript API. Look here for information to get started.
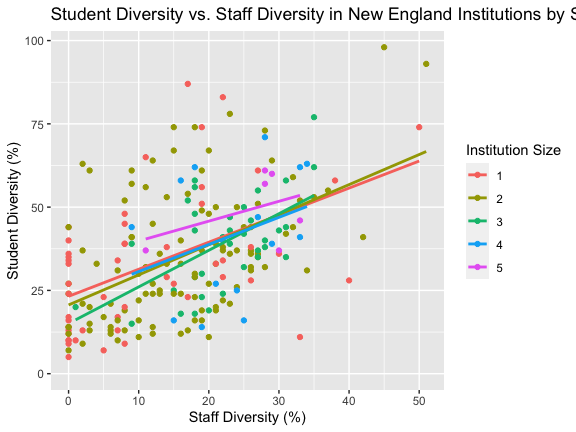
IPEDS v0.1.1: Implements an interface to the US Post-Secondary Institution Statistics for 2020 which contains information on post-secondary institutions, students, faculty, demographics, financial aid, educational and recreational offerings, and completions. See the vignette.
npi v0.2.0: Provides access the US National Provider Identifier Registry API which contains administrative data linked to a specific individual or organizational healthcare providers. There is an Introduction and a vignette on Advanced Use.
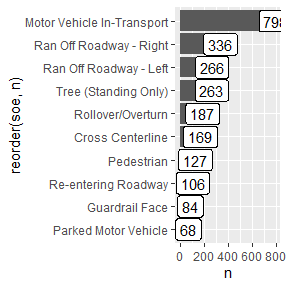
rfars v0.2.0: Implements an interface to the US Fatality Analysis Reporting System. See the vignettes Crash Sequences and Rural Roads.
tidyDisasters v0.1.1: Provides a queryable data set that unites information from three complementary resources: Belgium’s Centre for Research on the Epidemiology of Disasters EMDAT, the US National Consortium for the Study of Terrorism GTD, and the US Federal Emergency Management Agency FEMA. There is a brief User Guide.
Ecology
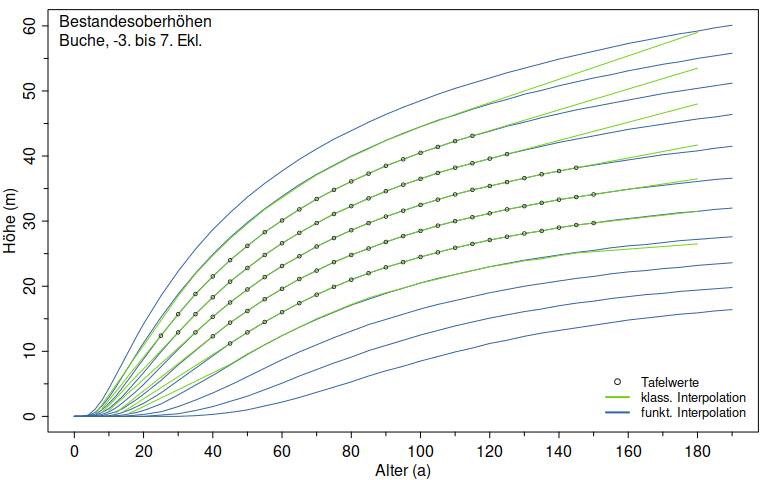
et.nwfva v0.1.1: Implements a forest management tool developed by the Northwest German Forest Research Institute (NW-FVA) for the five main commercial tree species oak, beech, spruce, Douglas-fir and pine for northwestern Germany. See Albert et al (2022) for background and the vignettes: Beispiele, Nutzerhinweise zum Geleit, and Vergleich der Interpolationsmethoden.
mmodely v0.2.2: Provides functions to perform multivariate modeling of evolved traits, with special attention to understanding the interplay of the multi-factorial determinants of their origins in complex ecological settings. See Stephens (2007), Gruebner (2011), and Garamszegi (2011) for background, and the examples on primate vision and vocal communications.
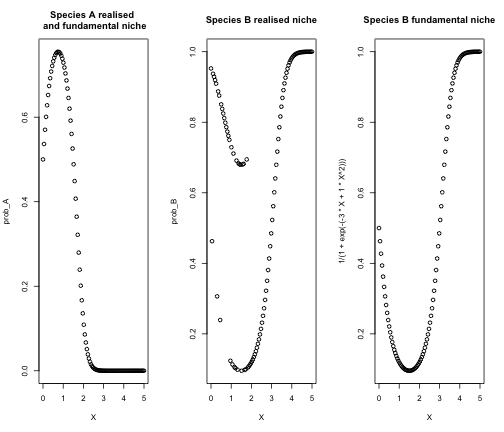
webSDM v1.1-1: Implements the method of Poggiato et al. (2022) for working with tropic Species Distribution Models. There is an Introduction and there are vignettes on Composit variables, Differences between SDM and Trophic SDM.
Epidemiology
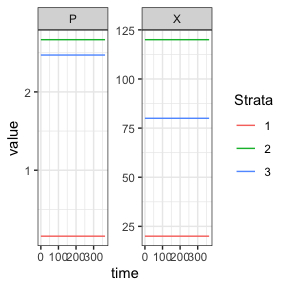
exDE v1.0.0: Provides tools to set up modular ordinary and delay differential equation models for mosquito-borne pathogens, focusing on malaria. See Wu et al. (2022) for a description on the methods implemented. There are ten vignettes including Basic Copmetition Aquatic Mosquito Model and SIP Human Model.
Genomics
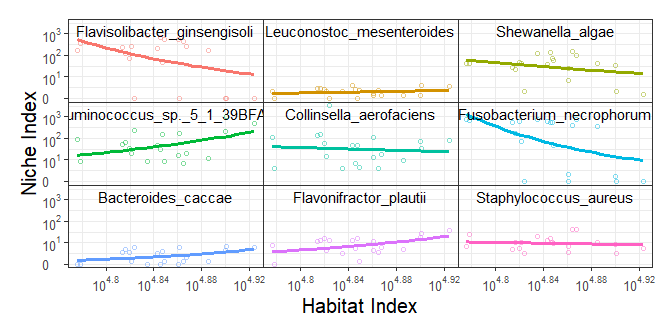
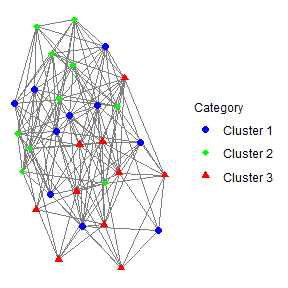
idopNetwork v0.1.1: Implements a cartographic tool to chart spatial microbial interaction networks. See Kim et al. (2008) and Wang et al. (2011) for information on functional clustering, Chen et al. (2019) and Cao et al. (2022) for background on the model, and the vignette for examples.
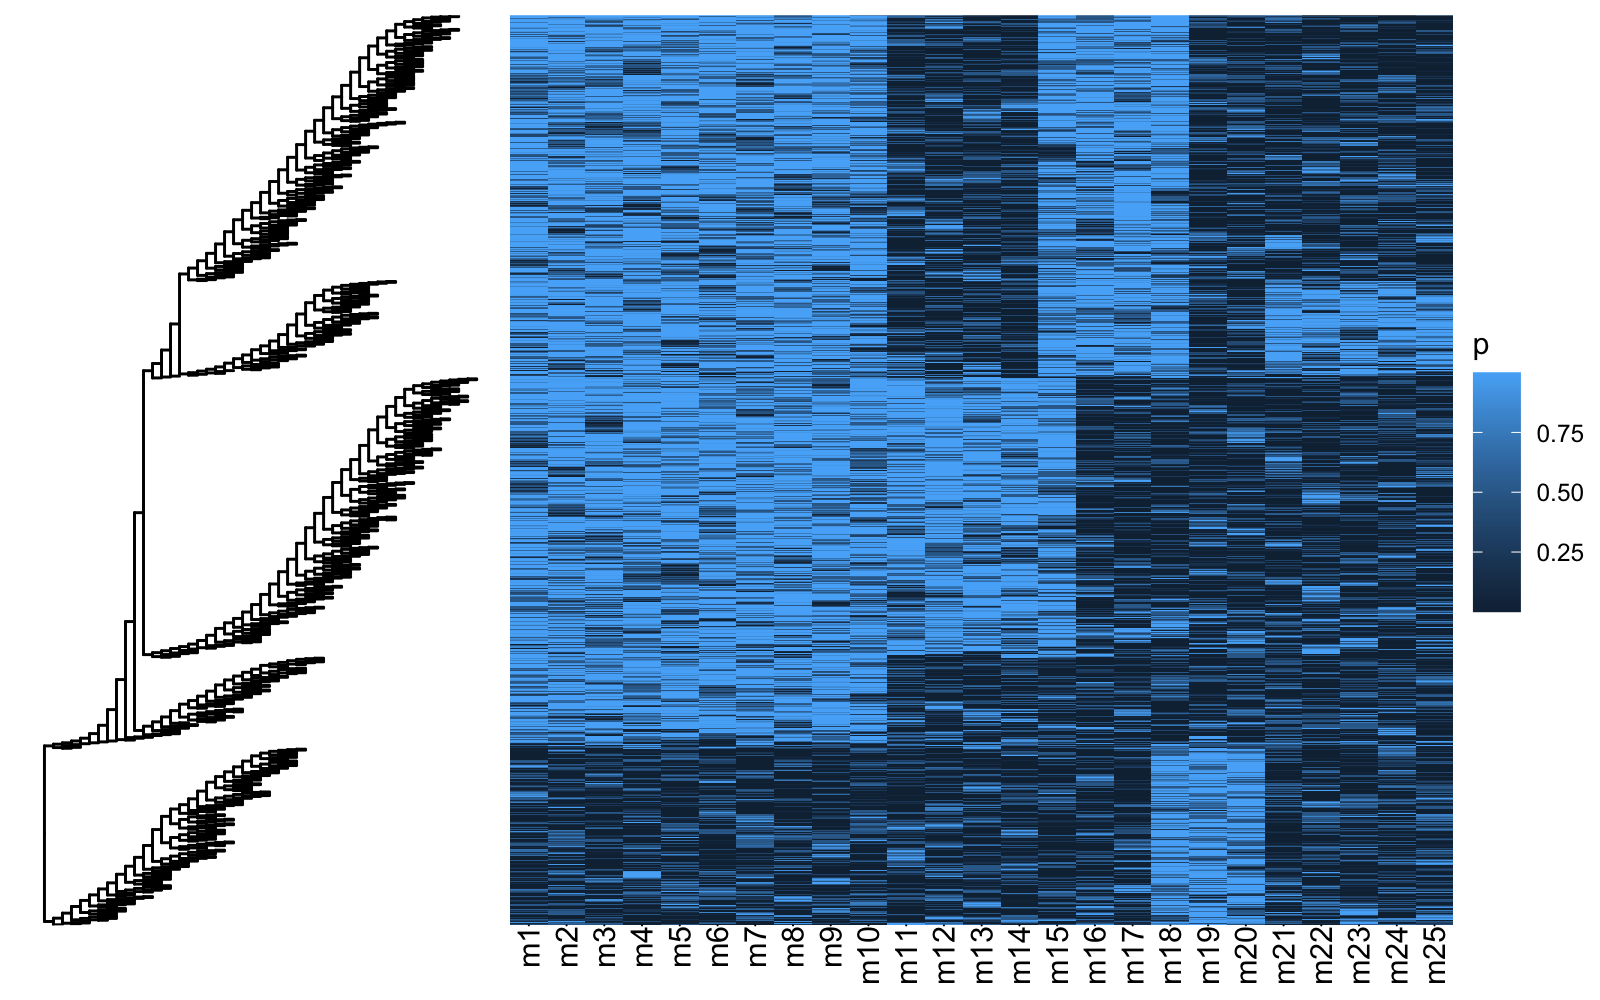
tip v0.1.0: Provides functions to cluster data without specifying the number of clusters using the Table Invitation Prior (TIP) introduced by Harrison et al. (2022). There are vignettes on matrix clustering with CONSTANT and MNIW, Tensor clustering CONSTANT, iris NIW, and usarrests NIW.
scistreer v1.0.1: Enables fast maximum-likelihood phylogeny inference from noisy single-cell data using the ScisTree algorithm described in Wu (2019) making the method applicable to massive single-cell datasets (>10,000 cells). Look here for an example.
Machine Learning
tidyclust v0.1.1: Implements a common interface to specifying clustering models, in the same style as parsnip. Creates unified interface across different functions and computational engines. See README for examples.

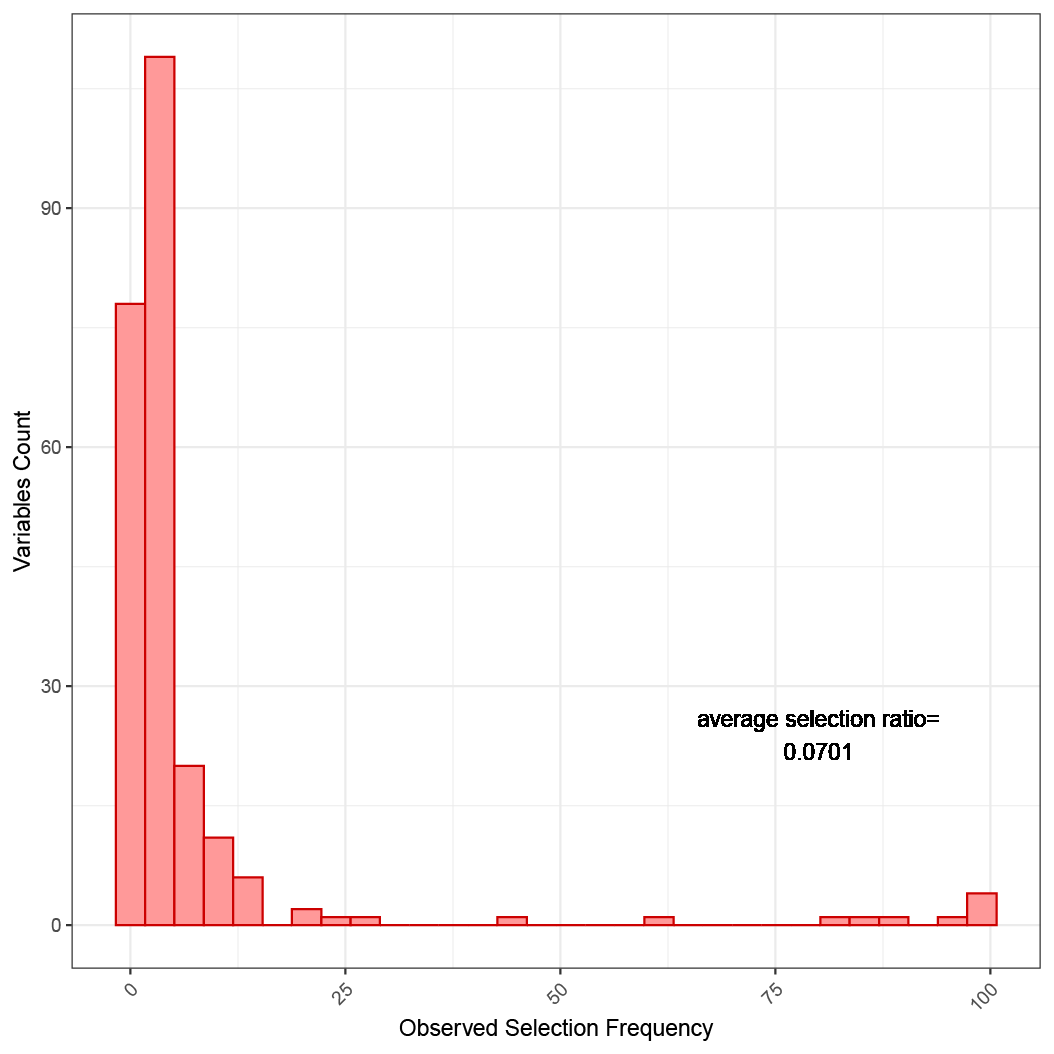
VSOLassoBag v0.99.0: Implements an integrated Wrapped LASSO ensemble learning strategy to help select efficient, stable, and high confidential variables from omics-based data. Functions integrate and vote on variables generated from multiple LASSO models to determine the optimal candidates. See Luo et al. (2020) for details and the vignette for examples.
Mathematics
tensorFun v0.1.1: Provides basic functions to handle higher-order tensor data. See Kolda and Bader (2009) for background on tensor decompositions, Bau and Ng (2021) for information on missing values, and the vignette for a short introduction.
TransTGGM V1.0.0: Implements a transfer learning framework for tensor Gaussian graphical models, which takes full advantage of informative auxiliary domains even when non-informative auxiliary domains are present. See Ren, Zhen, and Wang for background and the vignette.
Networks
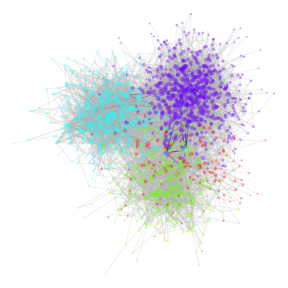
nett 1.0.0: Provides multiple methods for fitting, model selection and goodness-of-fit testing in degree-corrected stochastic blocks models. Implements the methods in Amini et al.(2013), Bickel and Sarkar (2015), Lei (2016), Wang and Bickel (2017) and more. There are vignettes Community Detection, Visualization, Explore Comm, and dcsbm testing.
Pharma
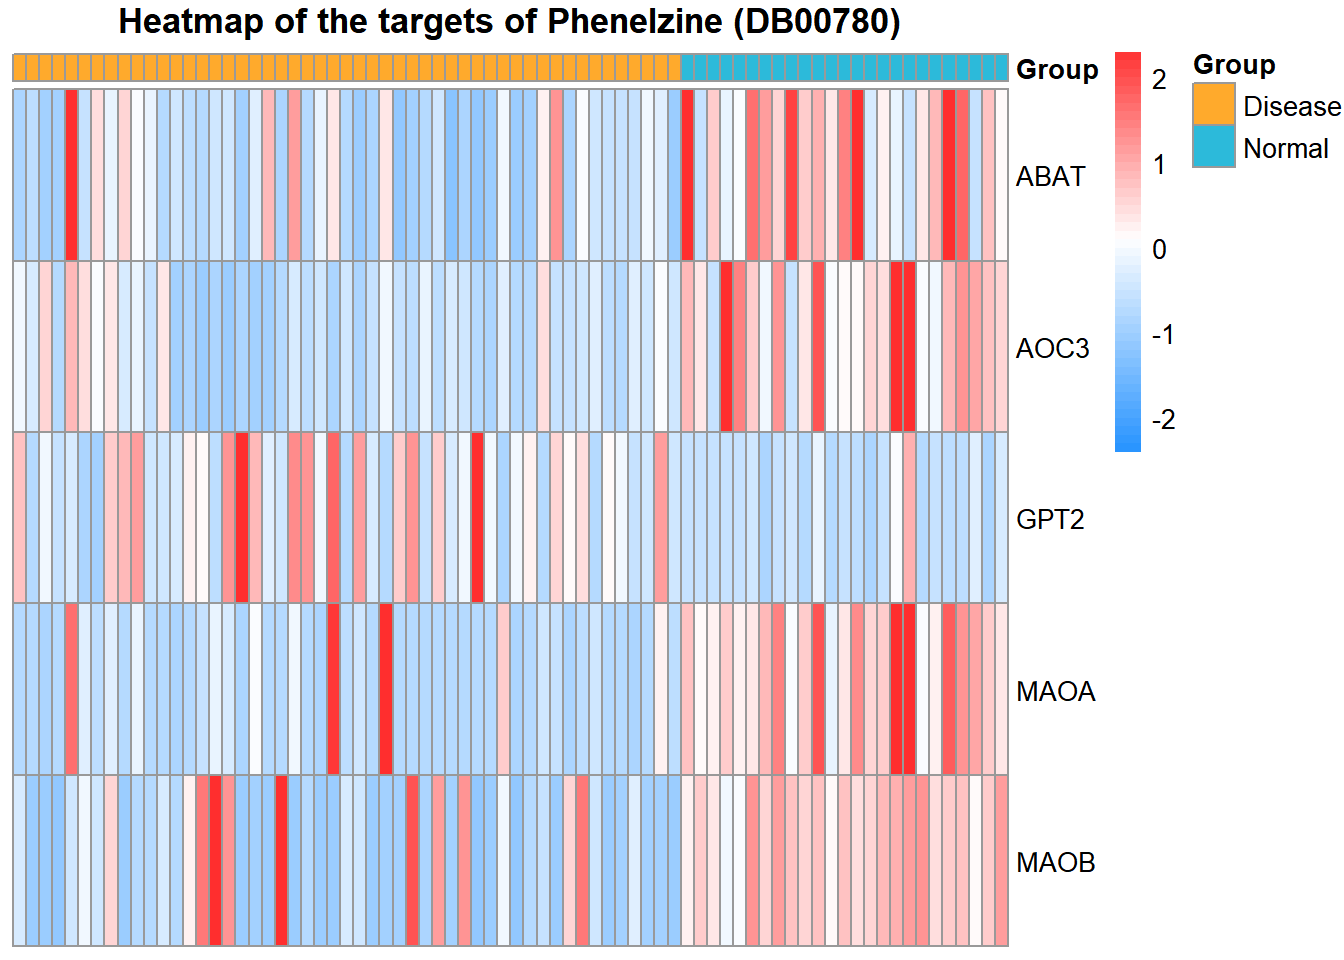
DrugSim2DR v0.1.0: Implements a tool to predict drug functional similarity for drug repurposing. See the vignette.
parttime v0.1.0: Provides classes for embedding partial missingness as a central part of datetime classes allowing for more ergonomic use of datetimes for challenging datetime computation, including calculations of overlapping date ranges, imputations, and more. See README for examples.
Statistics
GAGAs v0.5.1: Implements the Global Adaptive Generative Adjustment Algorithm for generalized liner models used for improving the computational efficiency in the high-dimensional data analysis. See Wang et al. (2022) for the theory.
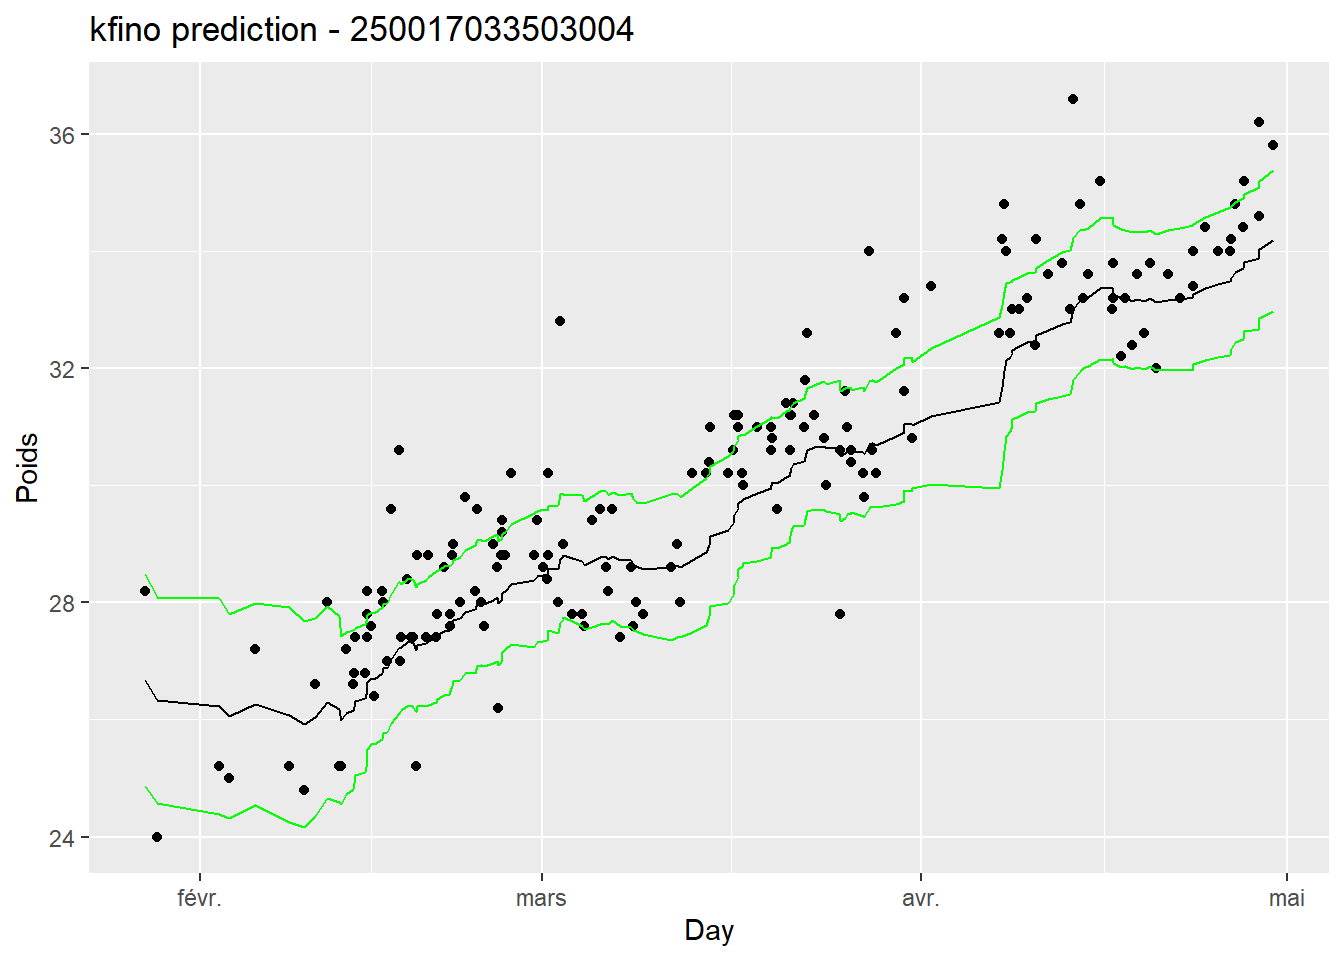
kfino v1.0.0: Implements method for detecting outliers with a Kalman filter on impulsed noised outliers and prediction on cleaned data. See Cloez et al. (2022) for the details and the vignettes on outlier detection and outlier detection with parallelization.
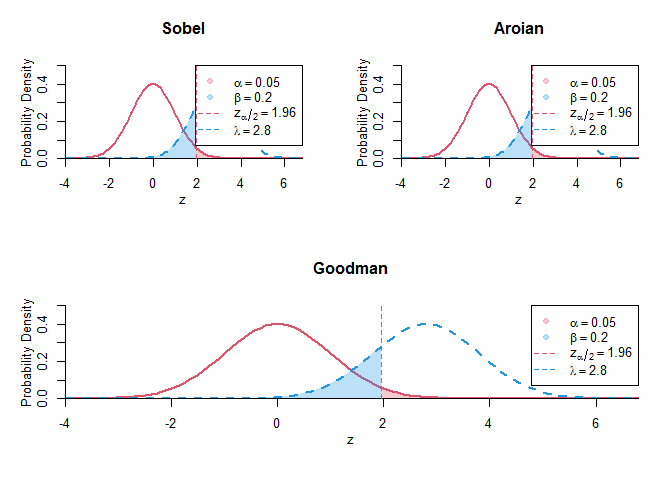
pwrss v0.2.0: Implements power and sample size calculations for a number of one, two and three sample tests. See the vignette for examples.
spatstat.models v3.0-2: A member of the spatstat family of packages, it provides multiple functions for exploratory data analysis and nonparametric analysis of spatial data, mainly spatial point patterns. See spatstat.org for documentation.
vMF v0.0.1: Provides functions for fast sampling from von Mises-Fisher distribution using the method proposed in Wood (1994). See the vignette.
Time Series
ardl.nardl v1.2.2: Implements linear and nonlinear autoregressive distributed lag (ARDL & NARDL) models and the corresponding error correction models and includes a test for long-run and short-run asymmetry and the Pesaran, Shin & Smith (2001) bounds test for level relationships.
Utilities
cookies v0.2.0: Provides tools for working with cookies in shiny apps, in part by wrapping the js-cookie JavaScript library. See README for an example.
formatdown v0.1.1: Provides a small set of tools for formatting tasks when creating documents in rmarkdown or quarto. See the vignette.
hellorust v1.0.0: Implements tools to use Rust code in R without hacks or frameworks. Includes basic examples of importing cargo dependencies, spawning threads and passing numbers or strings from Rust to R. Look here and here for for documentation.
prismjs v1.1.0: Implements a server-side rendering in R using Prism, a lightweight, extensible syntax highlighter, built with modern web standards in mind such that no JavaScript library is required in the resulting HTML documents. Look here for examples.
rjtools v1.0.9: Provides tools to create an R Journal rmarkdown template article, that will generate HTML and PDF versions of your paper. There are vignettes rjtools-template, Check, Create article, and Format details.
Visualization
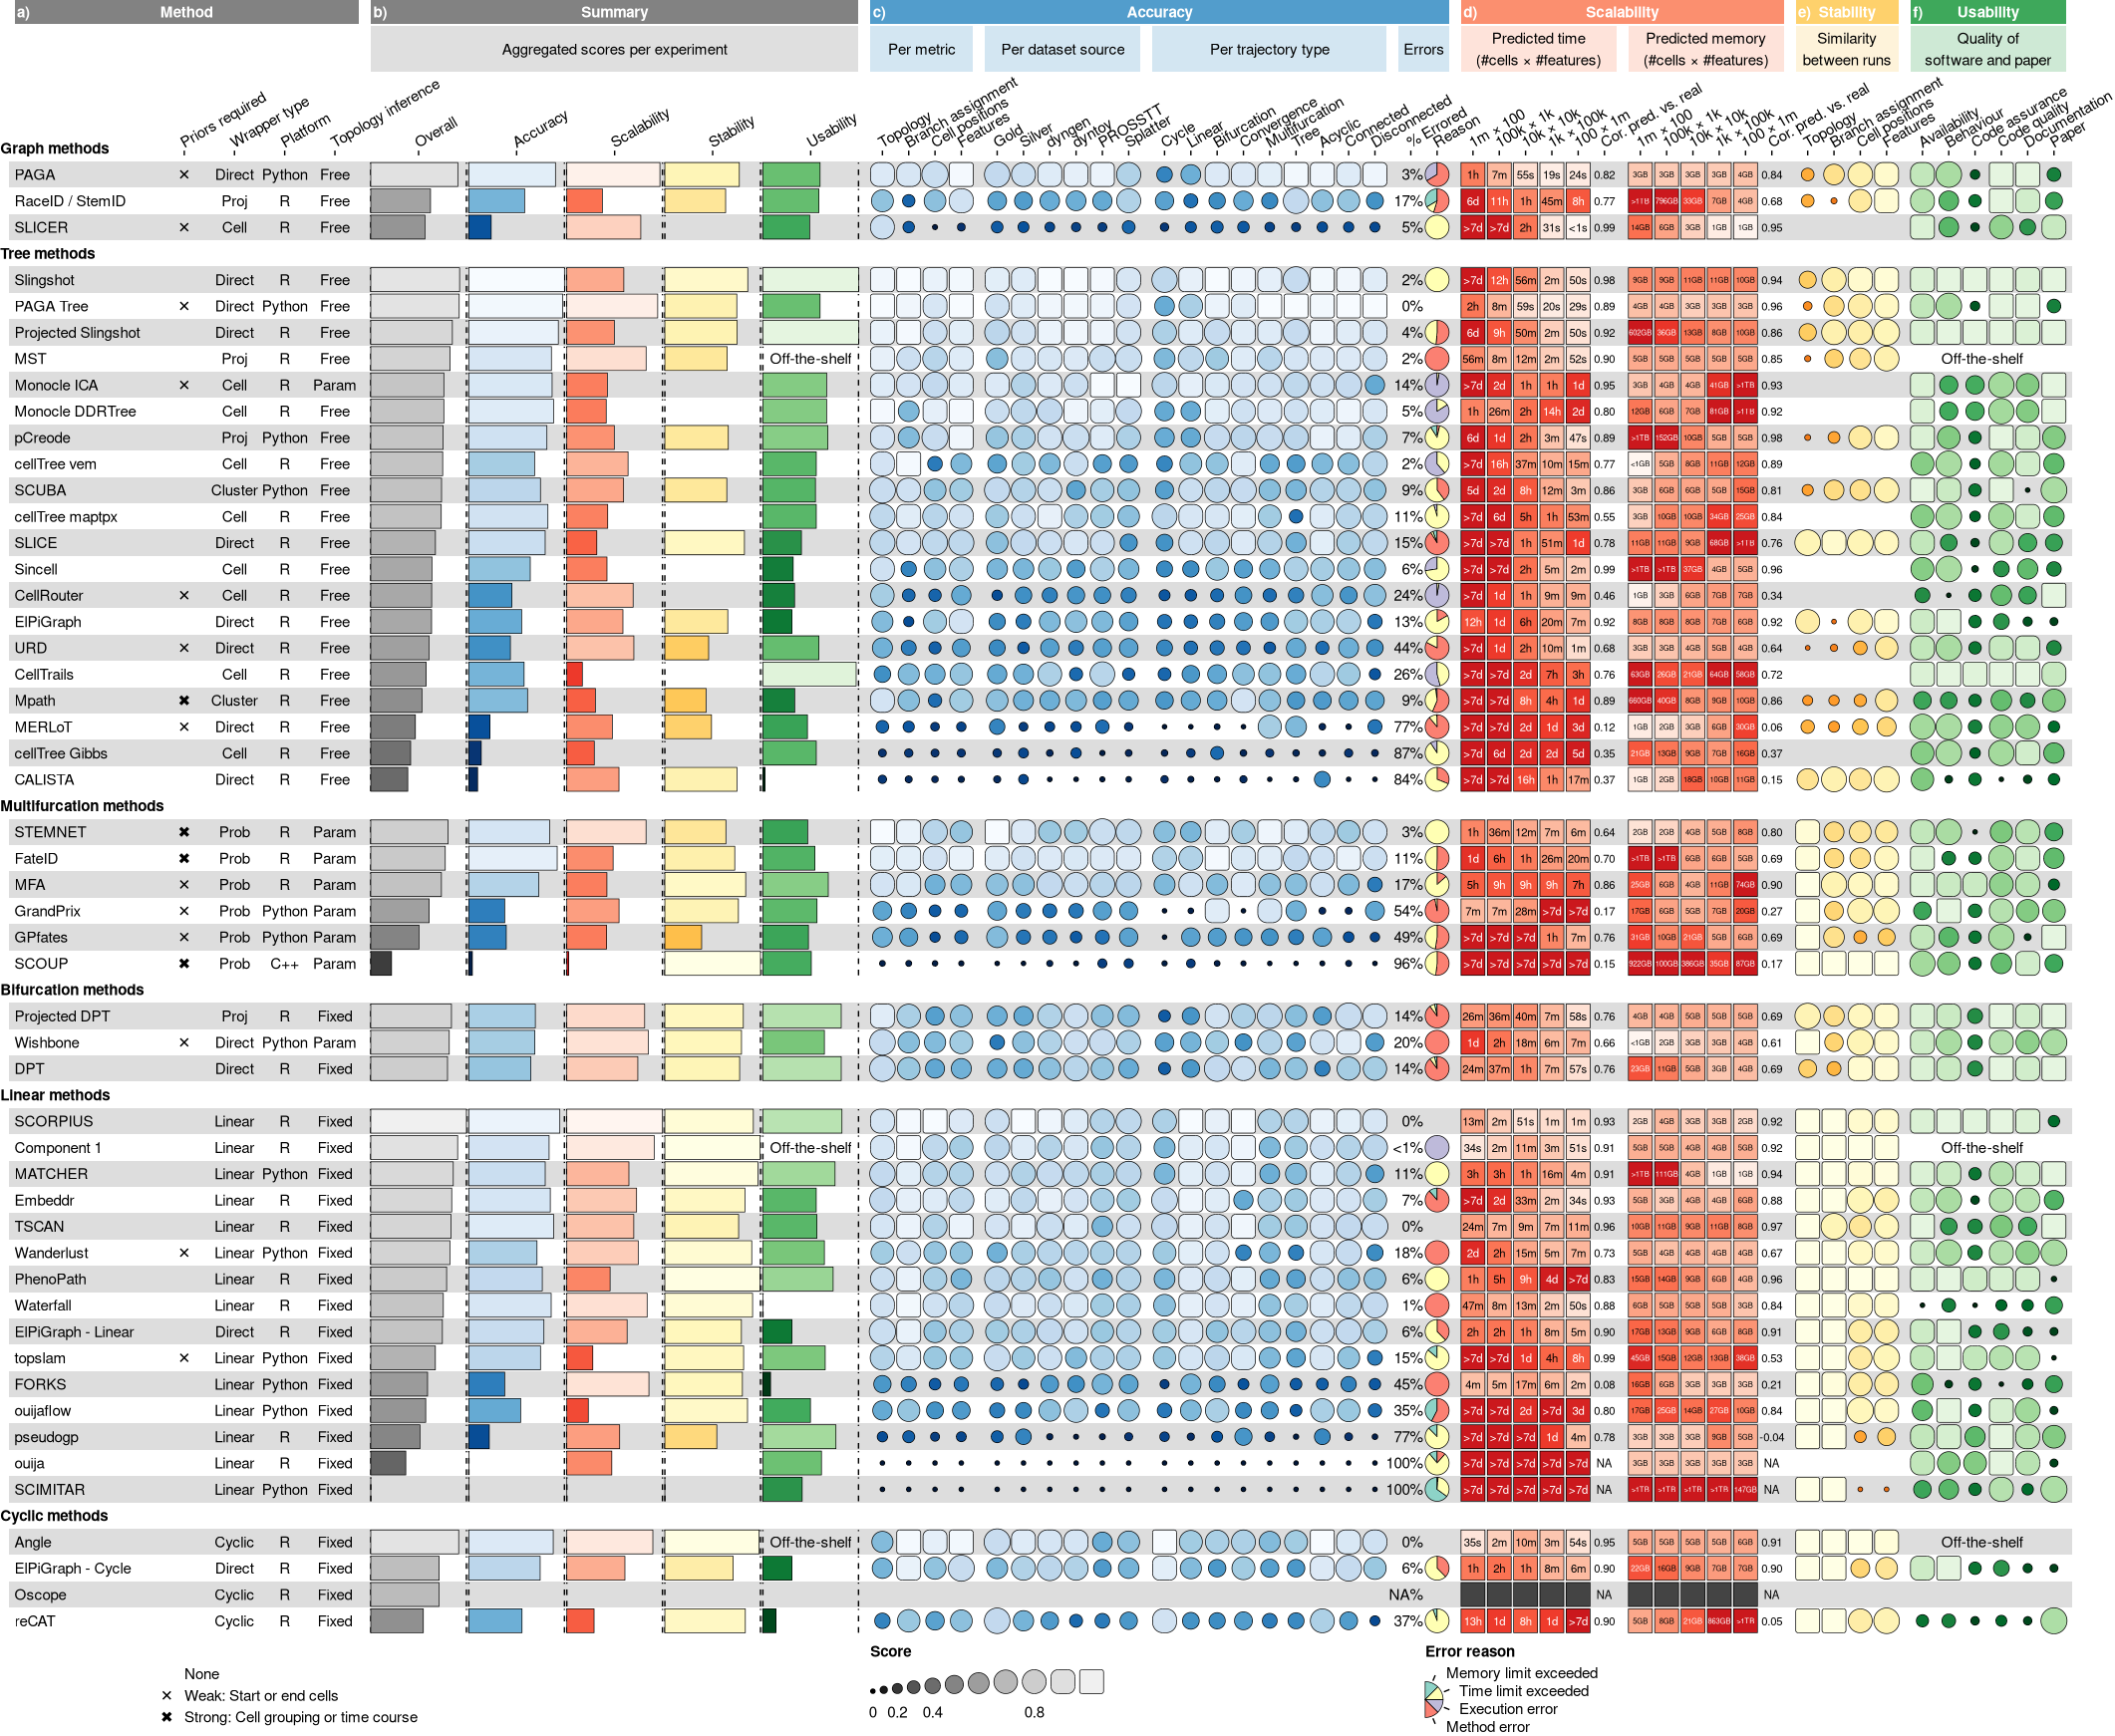
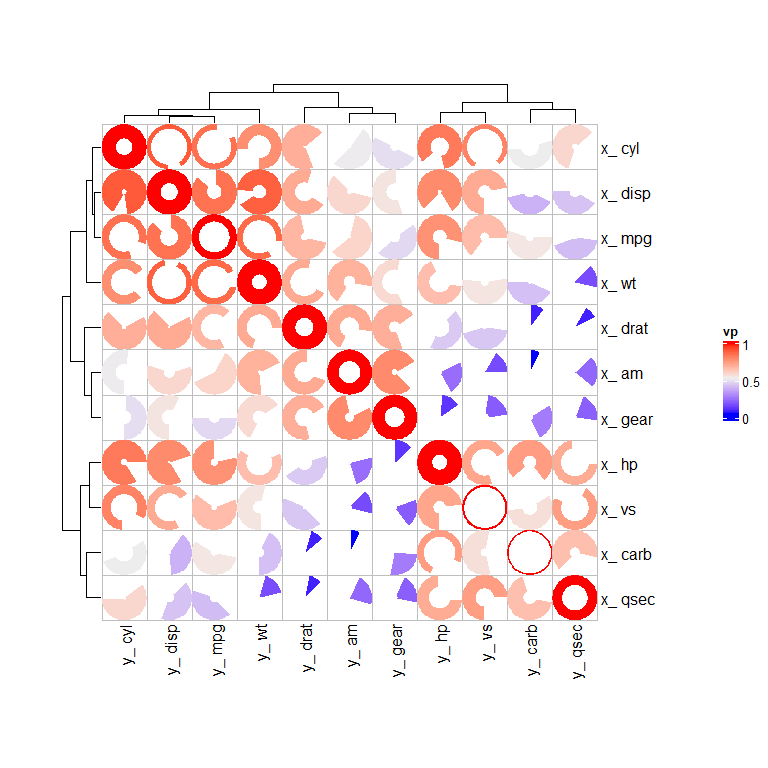
funkyheatmap v0.1.0: Provides functions for generating heatmap-like visualizations for benchmark data frames, which can be fine-tuned with annotations for columns and rows. See Saelens et al. (2019) for background and the vignettes Recreating the dynbenchmark figures and Demo with mtcars for examples.
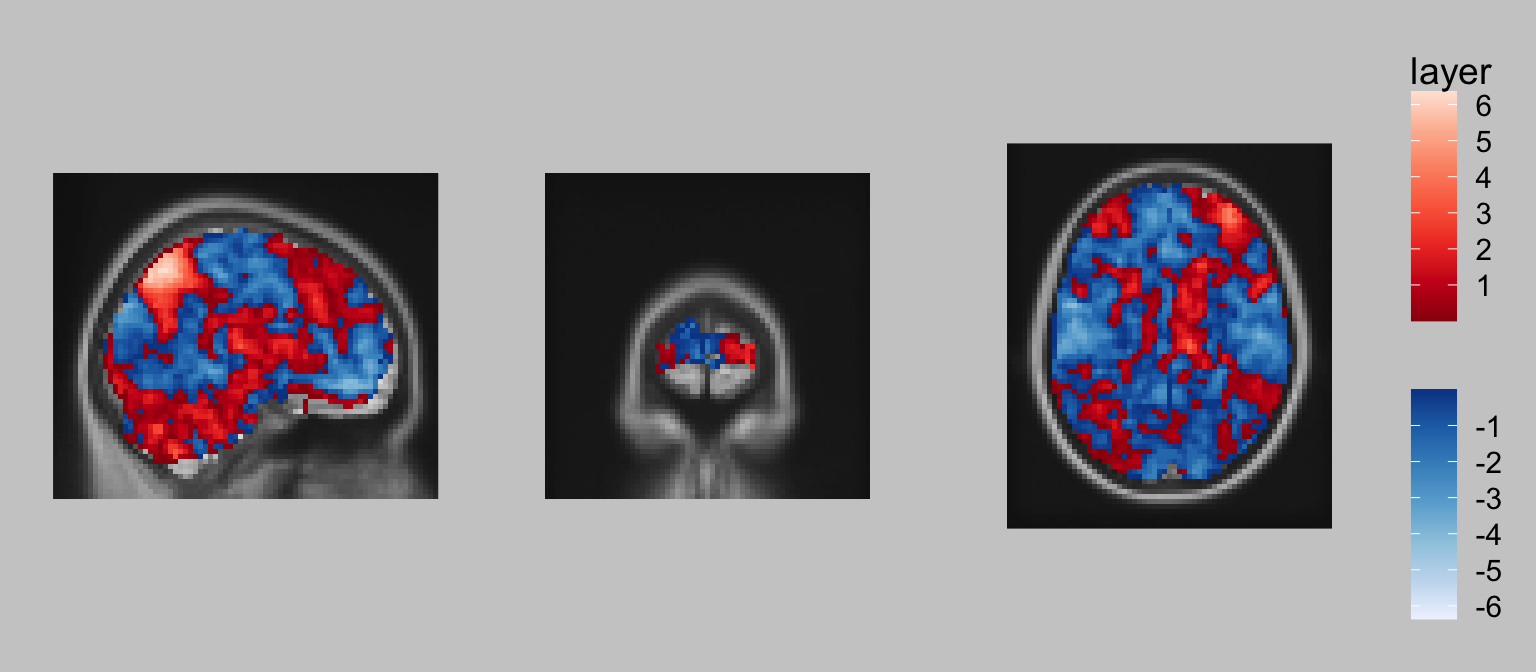
ggbrain v0.8.0: Implements a ggplot2-consistent approach to generating 2D displays of volumetric brain imaging data from multiple NIfTI images. There is an Introduction and there are vignettes on Aesthetic refinement and Annotations and labels.
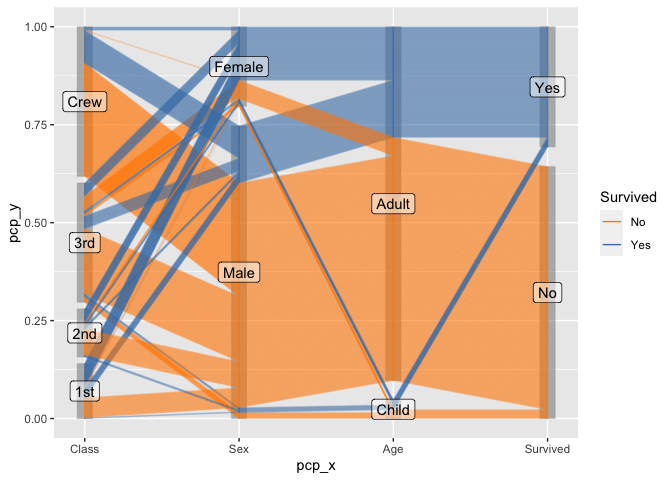
ggpcp v0.2.0: Provides a Grammar of Graphics implementation of parallel coordinate plots that incorporates categorical variables into the plots in a principled manner. Look here for examples.
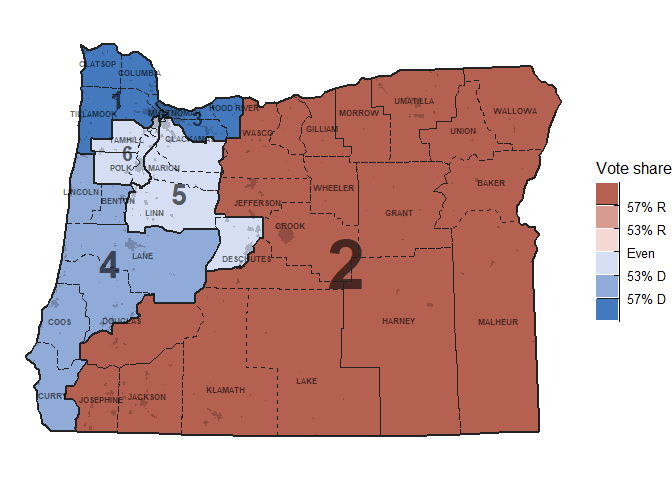
ggredist v0.0.2: Provides ggplot2 extensions for political map making based on simple features and includes palettes and scales for red to blue color mapping and for discrete maps. See README for an example.
ggsector v1.6.6: Implements functions that use grid and ggplot2 to plot sectors, draw complex heat maps and interact with Seurat to plot gene expression percentages. See the vignette.
sherlock v0.5.1: Provides graphical displays and statistical tools for structured problem solving and diagnosis with functions that are especially useful for applying the process of elimination as a problem diagnosis technique. See Hartsborne (2020) for background and README for examples.

You may leave a comment below or discuss the post in the forum community.rstudio.com.