One hundred sixty-five new packages made it to CRAN in January. Here are my “Top 40” selections in thirteen categories: Actuarial Statistics, Archaeology, Computational Methods, Ecology, Genomics, Mathematics, Medicine, Machine Learning, Science, Statistics, Time Series, Utilities, Visualization.
Actuarial Statistics
actuaRE v0.1.3: Provides functions to fit random effects models using either the hierarchical credibility model alone or combined with a glm or with a Tweedie generalized linear mixed model. See Campo & Antonio (2023) for background and the vignette for an example.
Archaeology
archeoViz v0.2.2: Implements a shiny application for the visualisation, interactive exploration, and web communication of archaeological excavation data. It includes interactive 3D and 2D visualisations, th generation of cross sections and maps, basic spatial analysis methods, and excavation timeline visualisations. There is a short vignette in English and French.
shoredate v1.0.0: Provides tools for shoreline dating Stone Age sites located on the Norwegian Skagerrak coast using methods presented in Roalkvam (2023). See the vignette.

Computational Methods
em v1.0.0: Implements a generic Expectation-Maximization (EM) algorithm within a maximum likelihood framework based on Dempster, Laird, and Rubin (1977). See the vignette for some theory and examples.
ROptimus v3.0.0: Implements a general-purpose optimisation engine that supports Monte Carlo optimisation with the Metropolis criterion and acceptance ratio replica exchange Monte Carlo optimization. See the foundational papers Metropolis et al. (1953), Hastings (1970), Kirkpatrick et al. (1983) and Černý (1985) for background.
Data
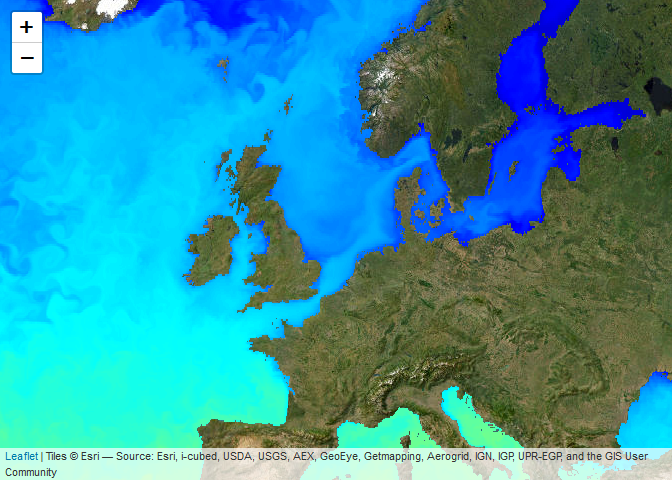
CopernicusMarine v0.0.6: Provides functions to import data on the ocean’s physical and biogeochemical state from EU Copernicus Marine Service Information. See README to get started.
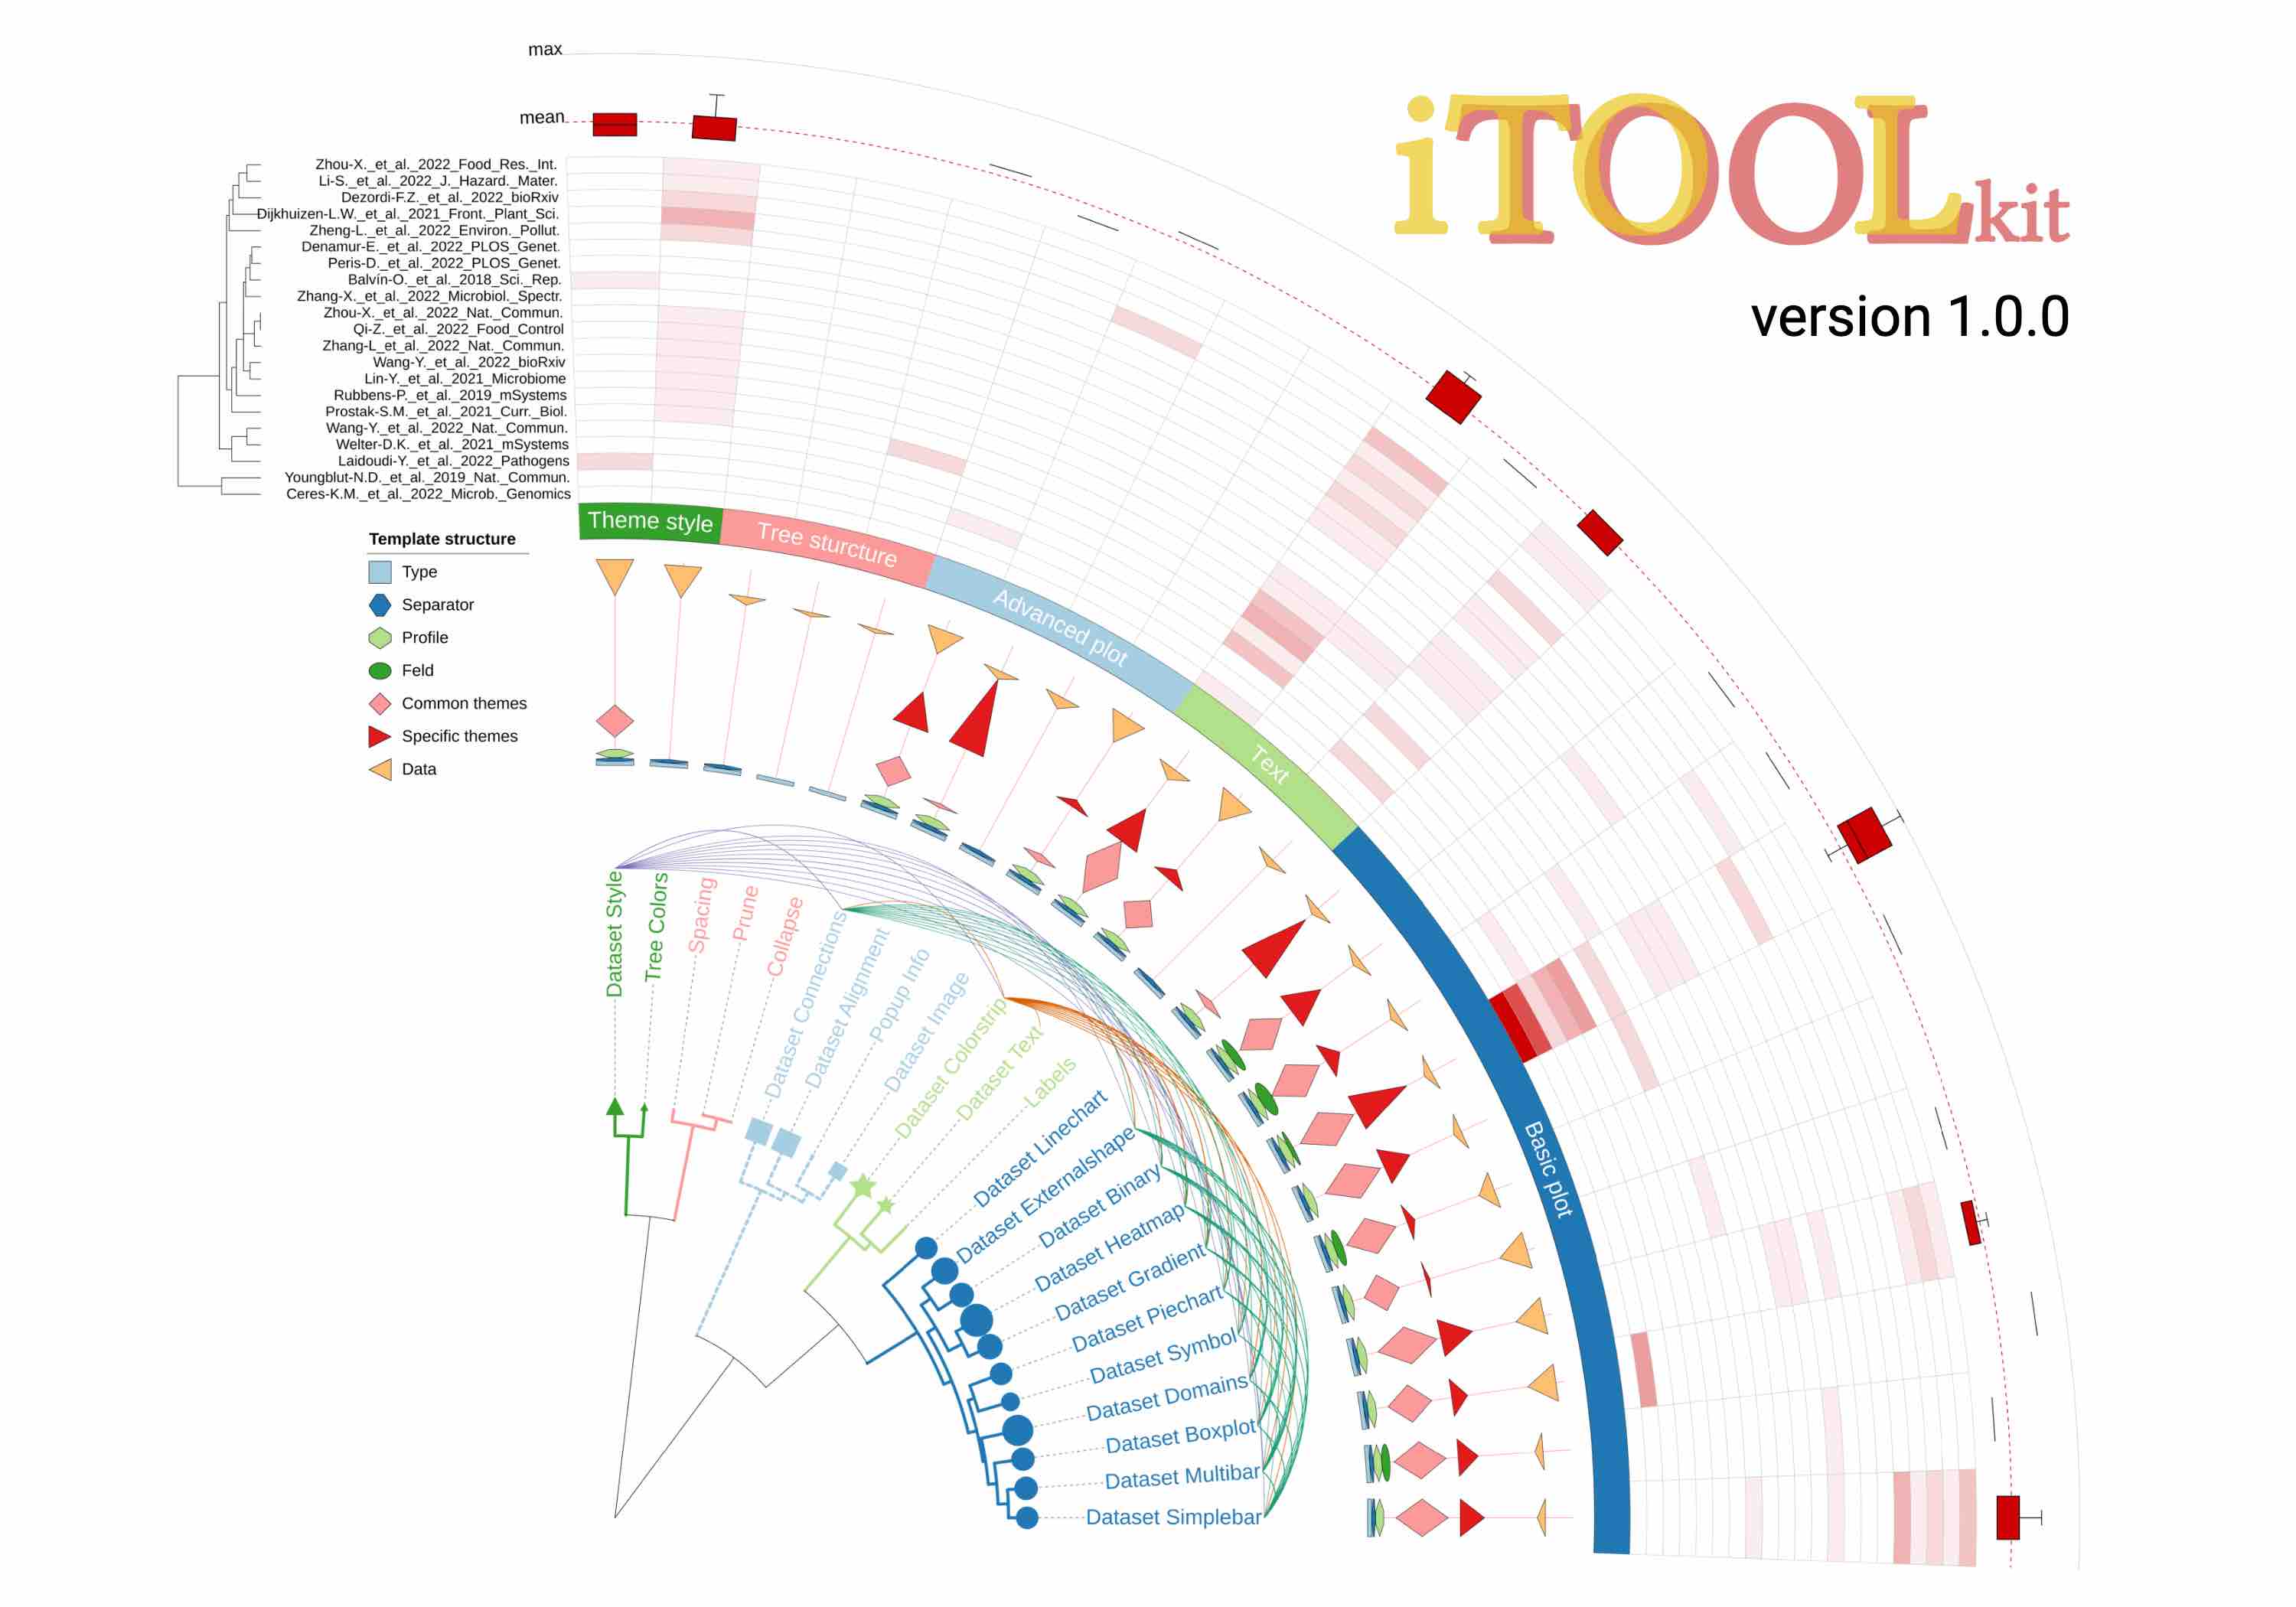
itol.toolkit v1.1.0: Provides helper functions to access the Interactive Tree of Life including functions to edit and annotate trees interactively. See the vignette to get started.
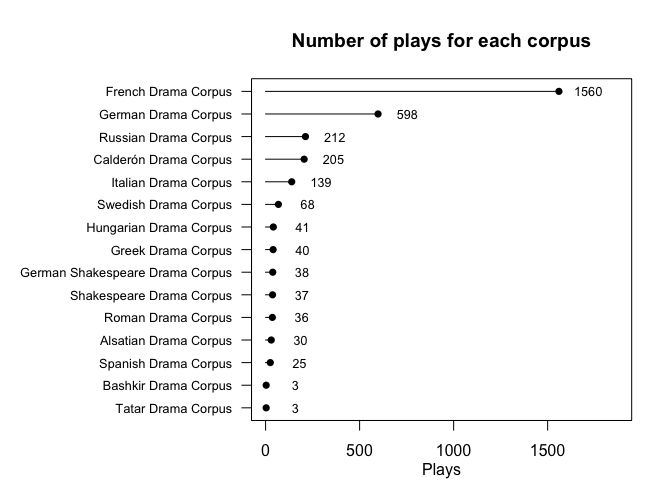
rdracor v0.7.2: Provides an interface to the Drama Corpora Project (DraCor) API.
usdoj v1.0.0: Provides functions to fetch data from the U.S Department of Justice API such as press releases, blog entries, and speeches. Look here for notes on data structure.
Ecology
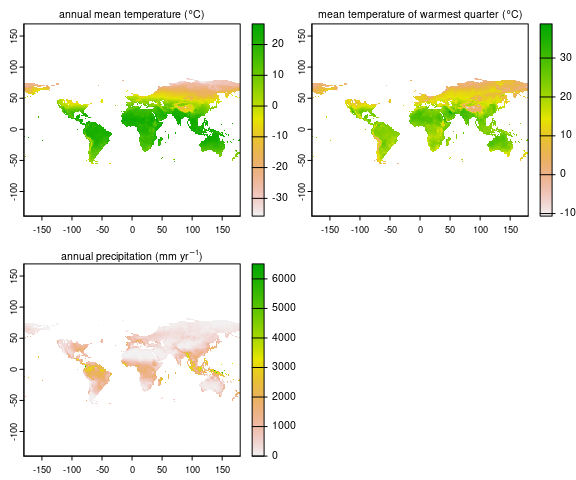
pastclim v1.2.3: Implements methods to extract and manipulate palaeoclimate reconstructions for ecological and anthropological analyses as described in Leonardi et al. (2022). See the Overview and the vignettes available datasets and custom dataset.
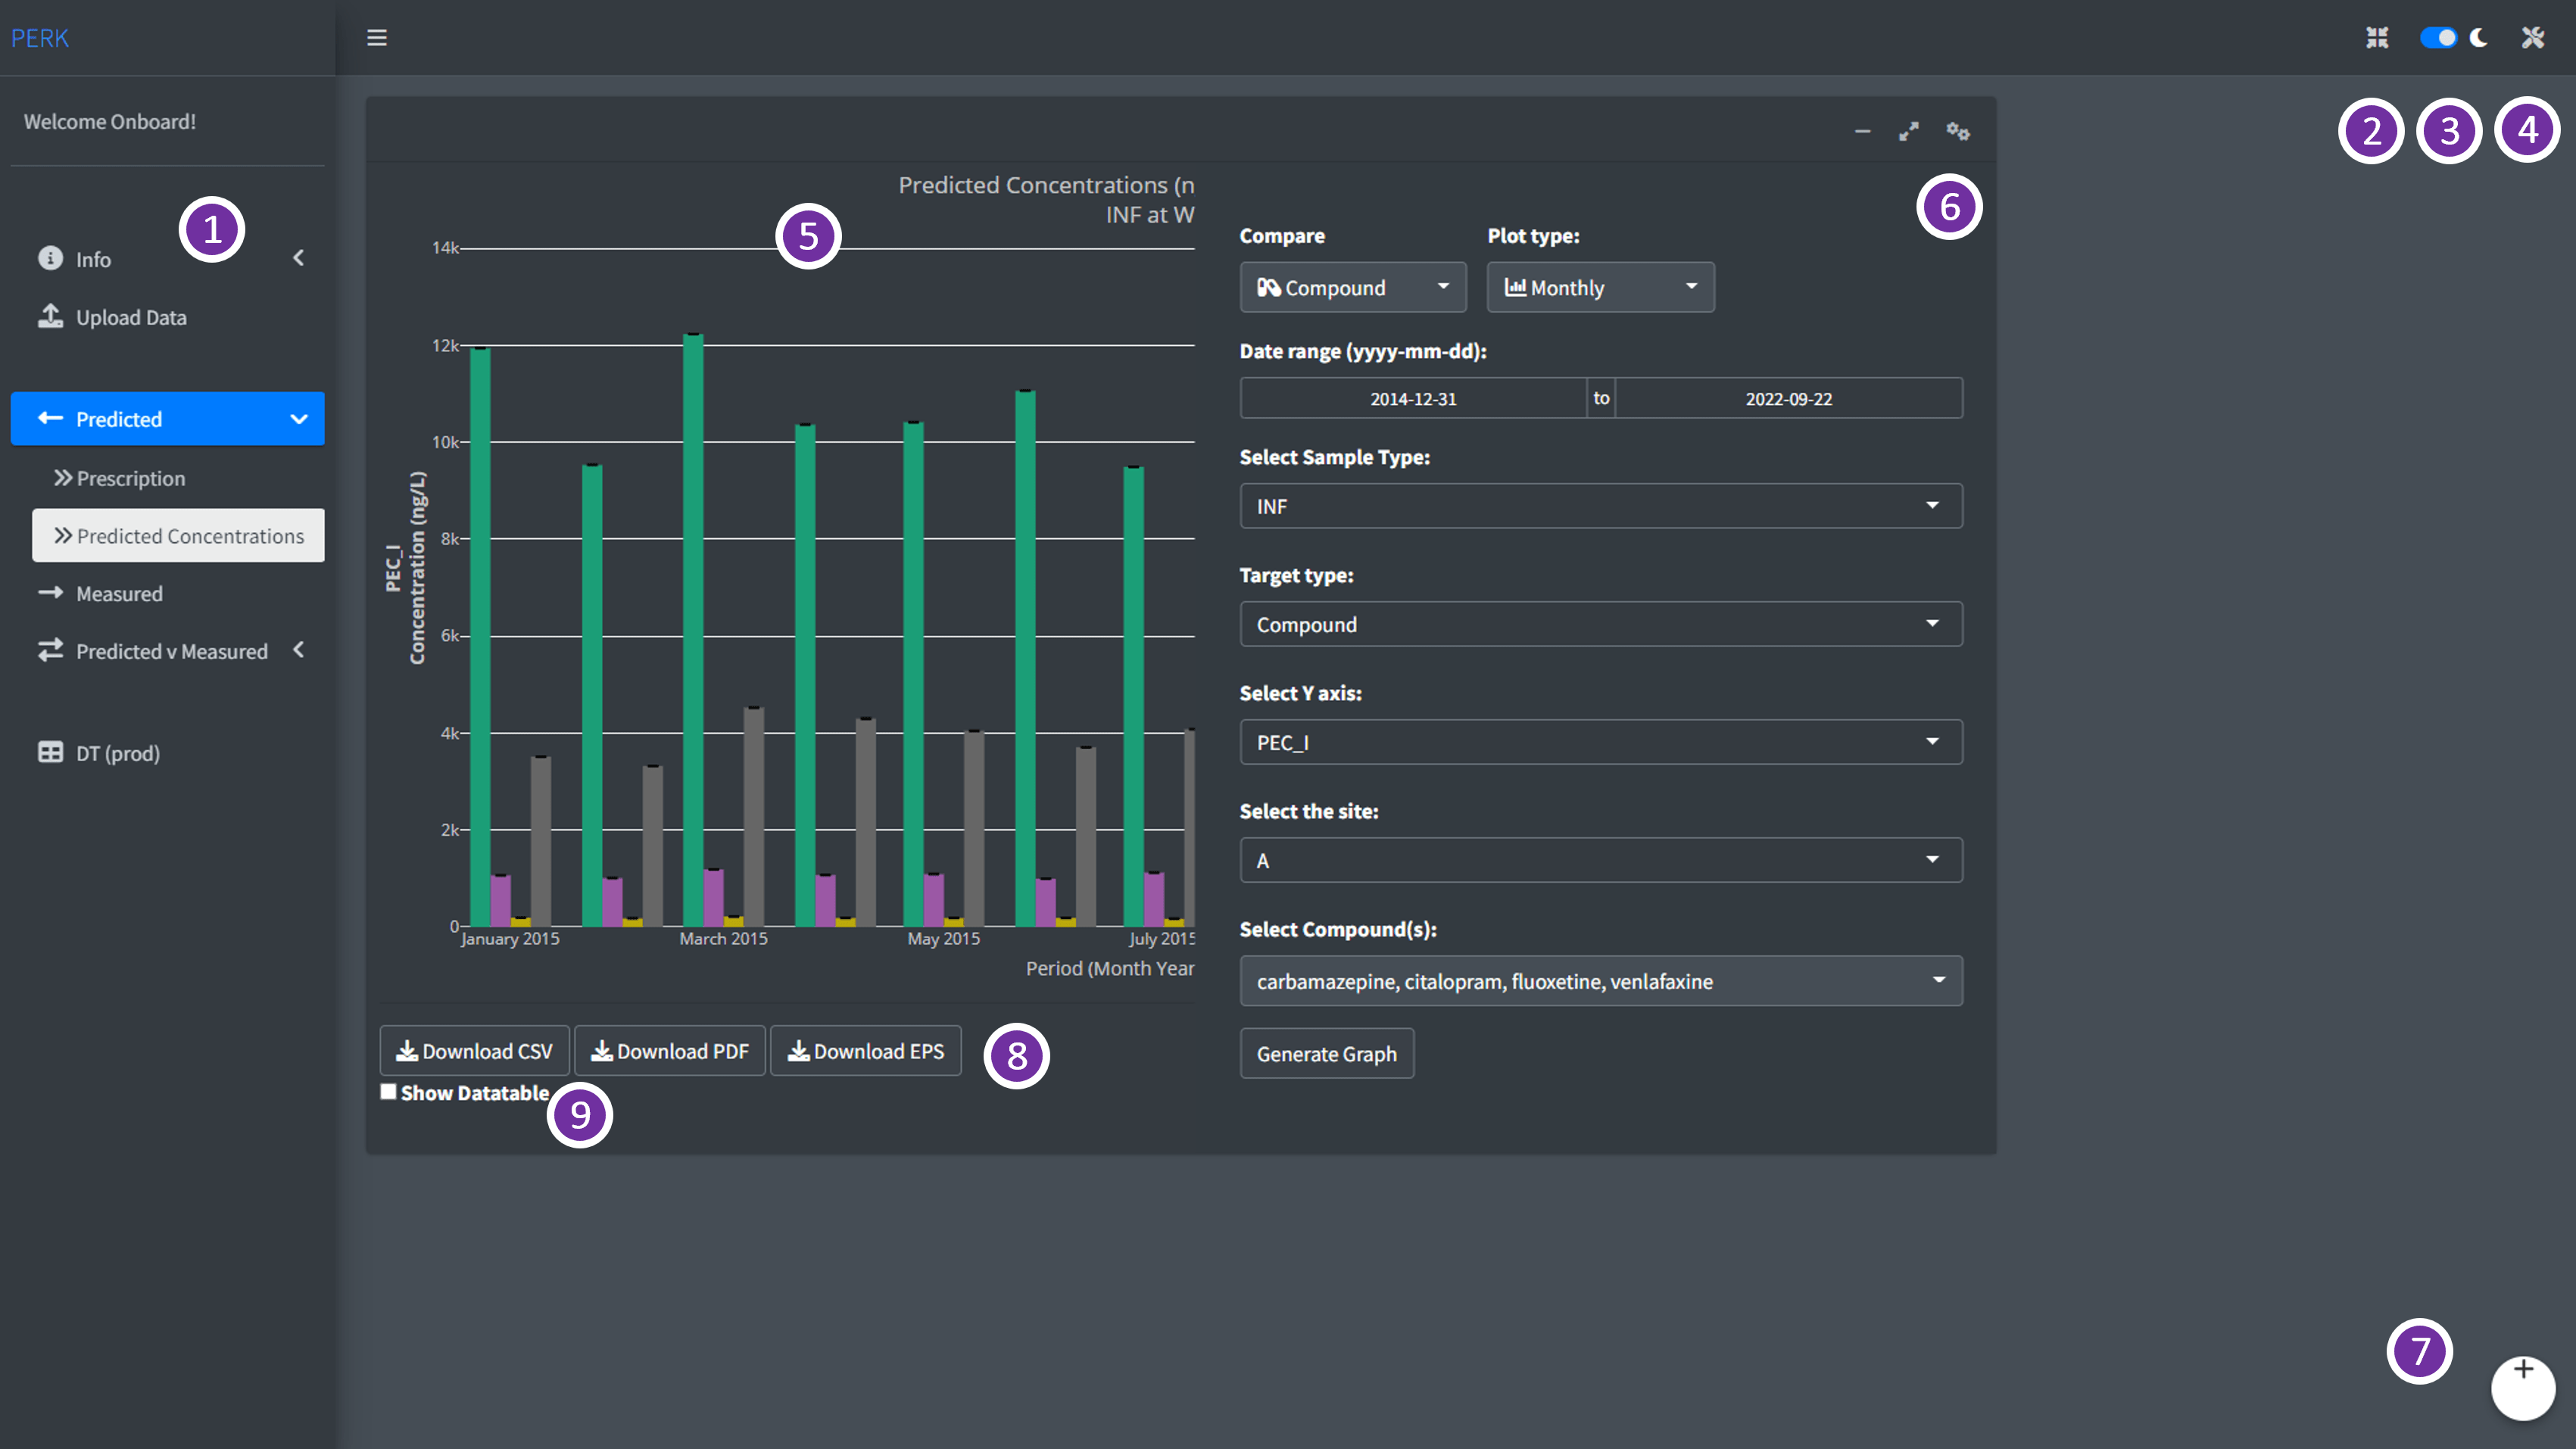
PERK v0.0.9.2: Implements a shiny web application to predict and visualize concentrations of pharmaceuticals in the aqueous environment. See Jagadeesan et al. (2022) and the vignette for a walk through.
Gemomics
autoGO v0.9.1: Implements a framework to enable automated, high quality gene ontology enrichment analysis visualizations and a wrapper for differential expression analysis using the DESeq2 package described in Love et al. (2014). See the vignette.

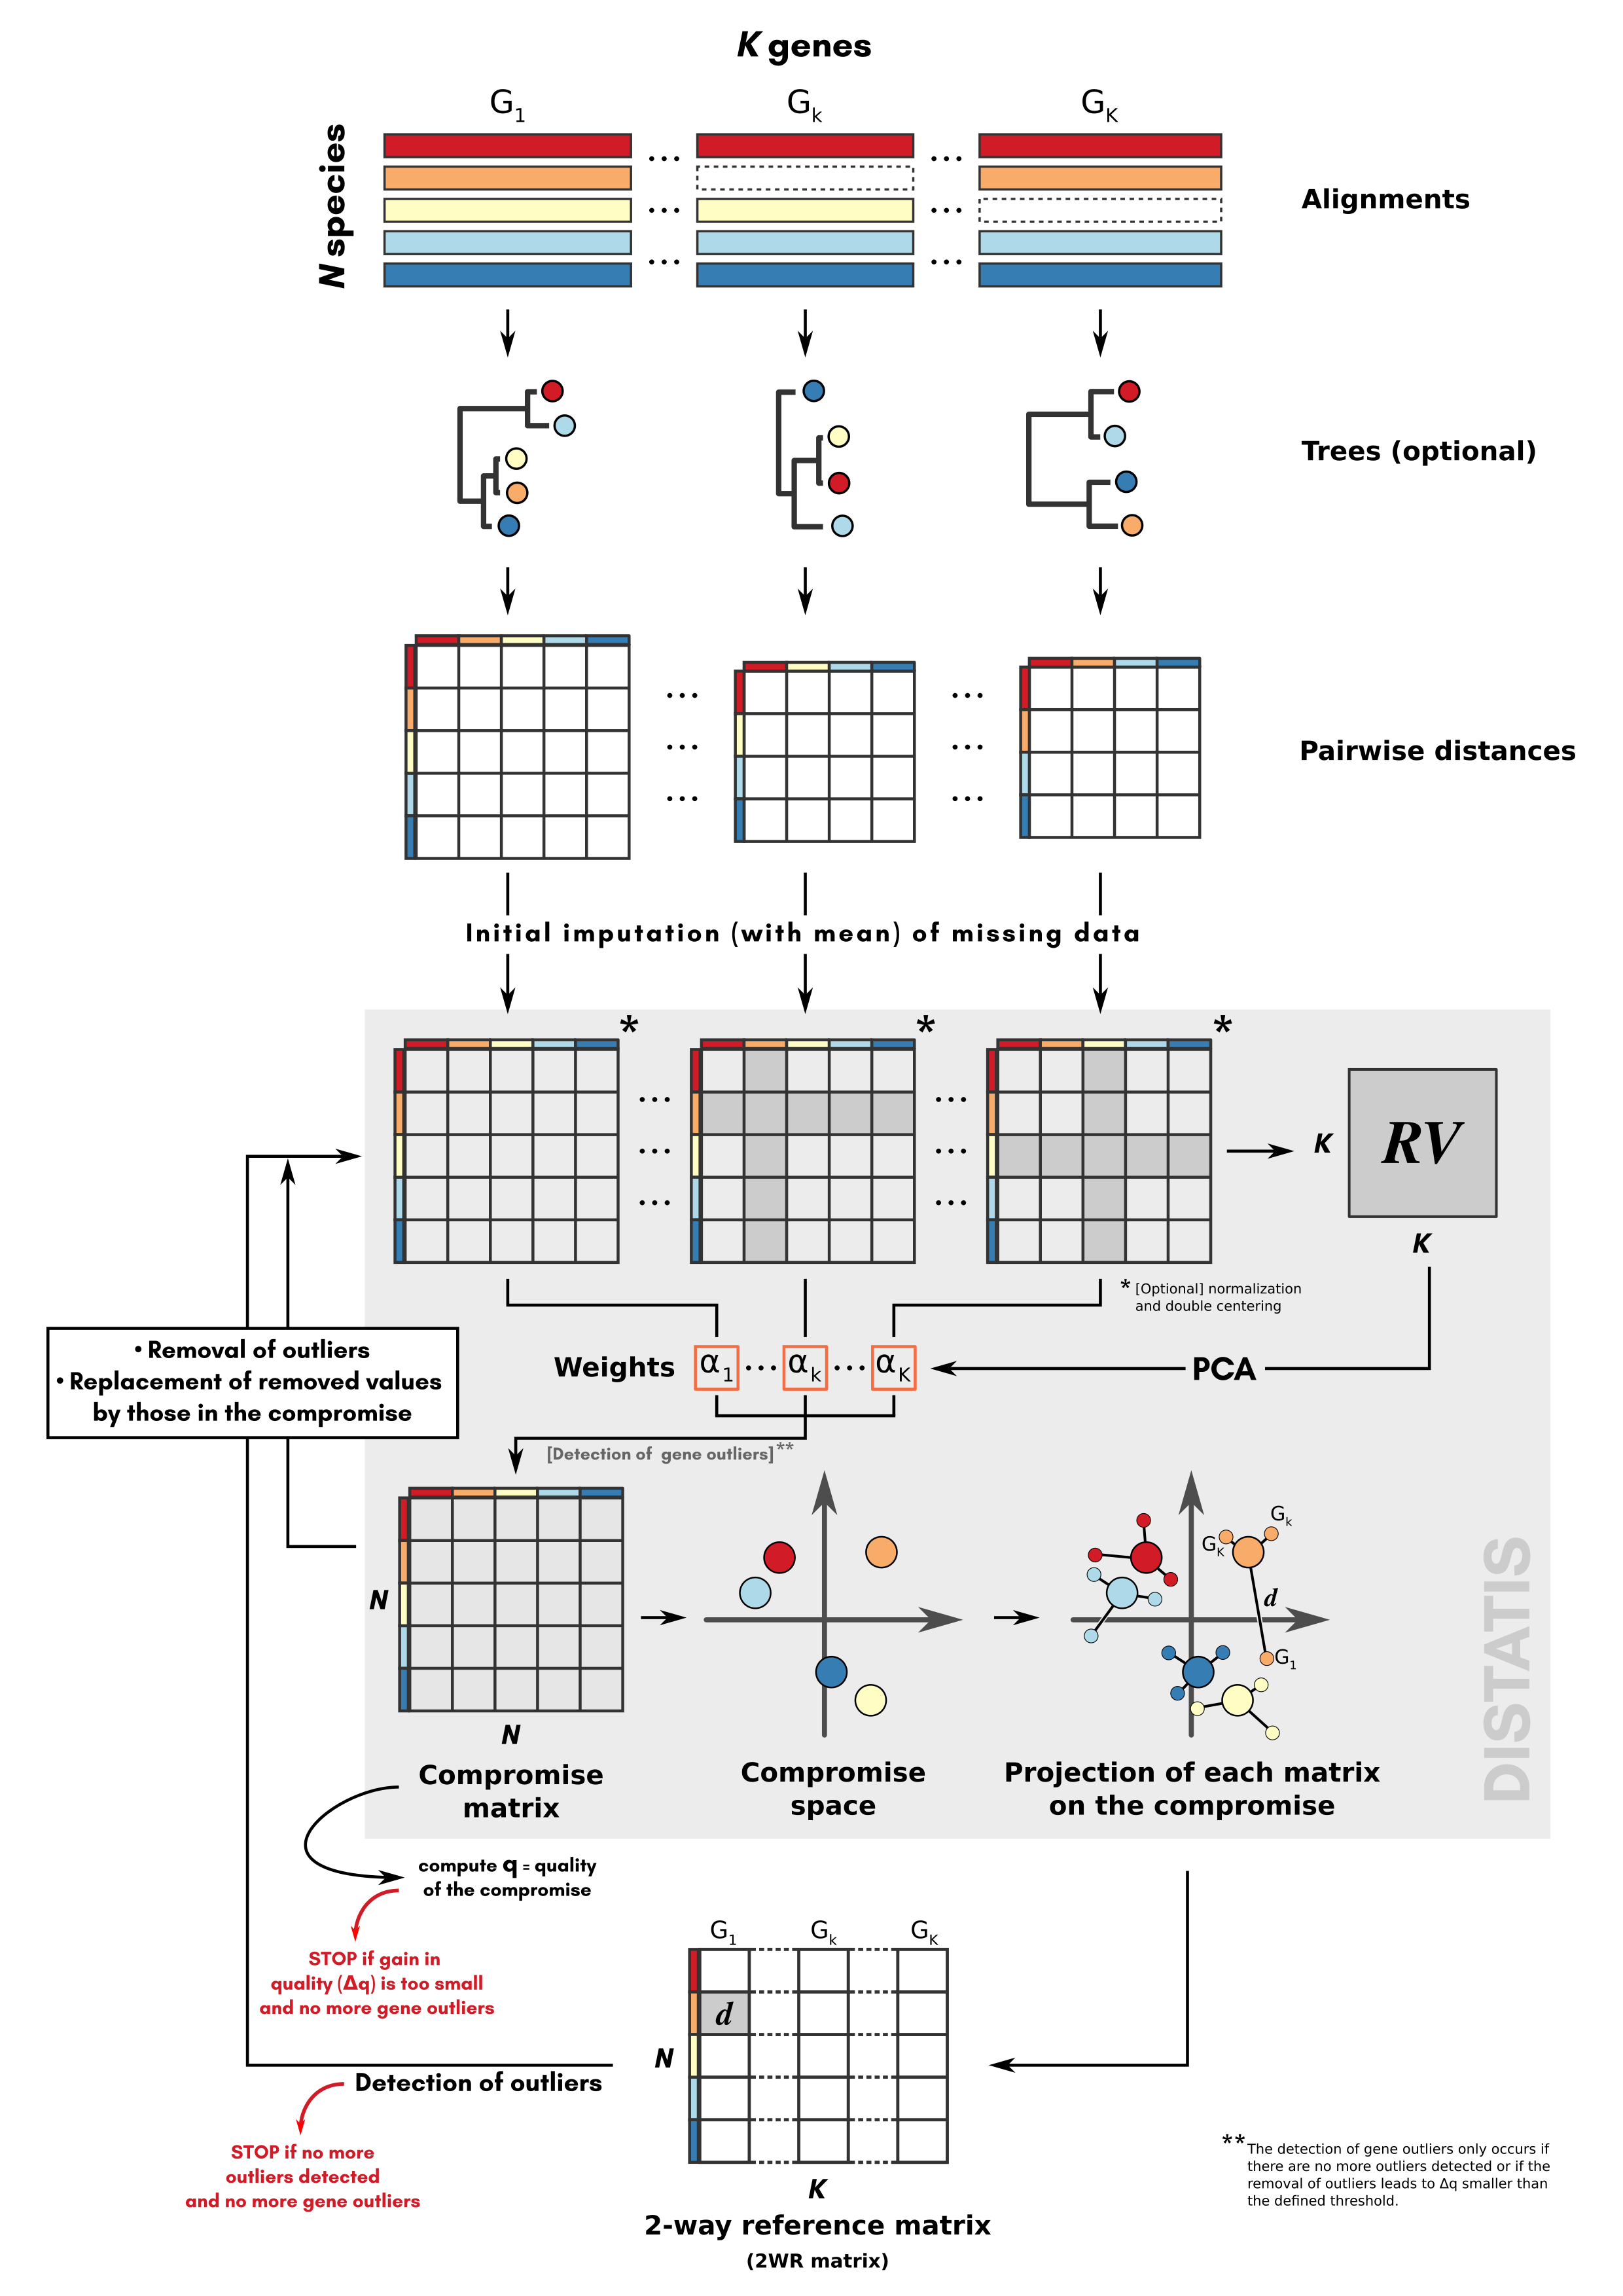
phylter v0.9.6: Provides functions to detect and remove outliers in phylogenomics datasets that build on the Distatis approach described in Abdi et al. (2005). See the vignette.
poolHelper v1.0.0: Provides functions to simulate pooled sequencing data under a variety of conditions, and also evaluate the average absolute difference between allele frequencies computed from genotypes and those computed from pooled data. See Carvalho et al. (2022) for the details and the vignette for an introduction to the package.
Machine Learning
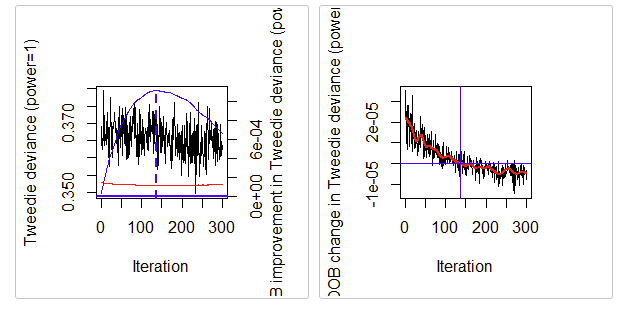
BT v0.3: Implements adaptive boosting trees for Poisson distributed response variables, using log-link function. See Trufin & Denuit (2021), Denuit et al. (2019), and Hainaut & Trufin (2022) for background, and the vignette for an example.
chatgpt v0.1.5: Implements a ChatGPT coding assistant for the RStudio IDE.
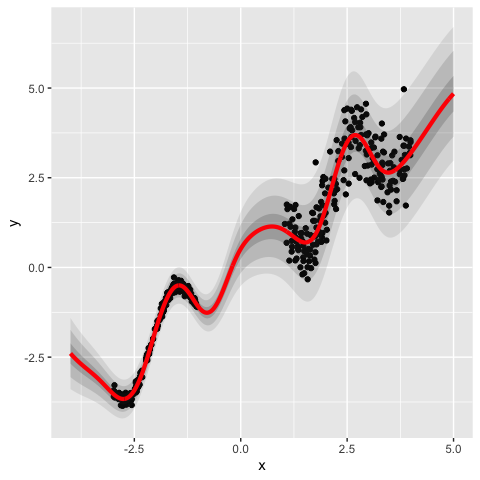
evreg v1.0.1: Implements a evidential neural network for the regression model recently introduced in Denoeux (2023) in which prediction uncertainty is quantified by Gaussian random fuzzy numbers as introduced in Denoeux (2023). See the vignette.
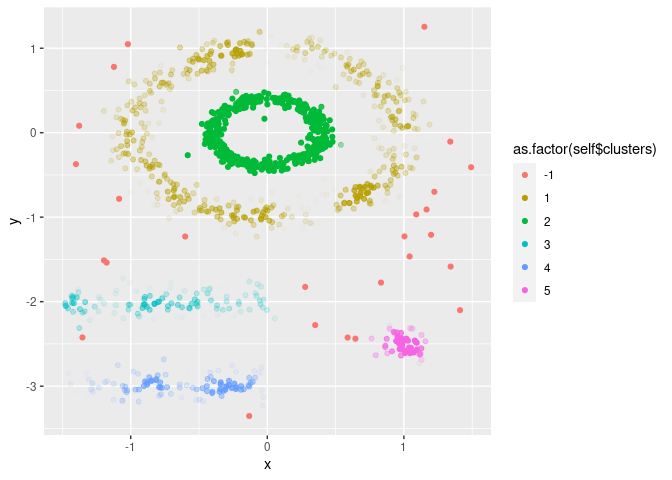
FuzzyDBScan v0.0.3: Provides an interface to the Fuzzy DBScan clustering algorithm described in Ienco and Bordogna (2018). See README for an example.
Mathematics
rgudhi v0.1.0: Implements and interface to the C++ library, GHUDI for topological data analysis (TDA) and offers state-of-the-art data structures and algorithms to construct simplicial complexes and compute persistent homology.
Medicine
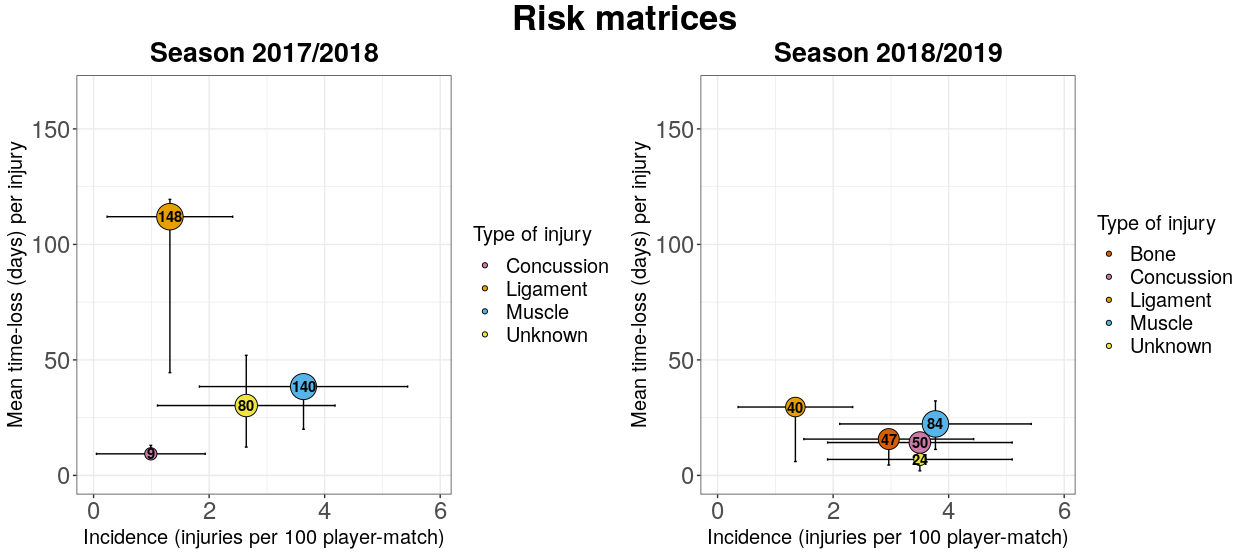
injurytools v1.0.1: Provides standardized routines and utilities to simplify the data analysis of sports injuries in order to identify and describe the magnitude of sports injury problems and determine the potential risk factors. See the vignettes estimate-epi-measures, prepare-injury-data. and visualize-injury-data.
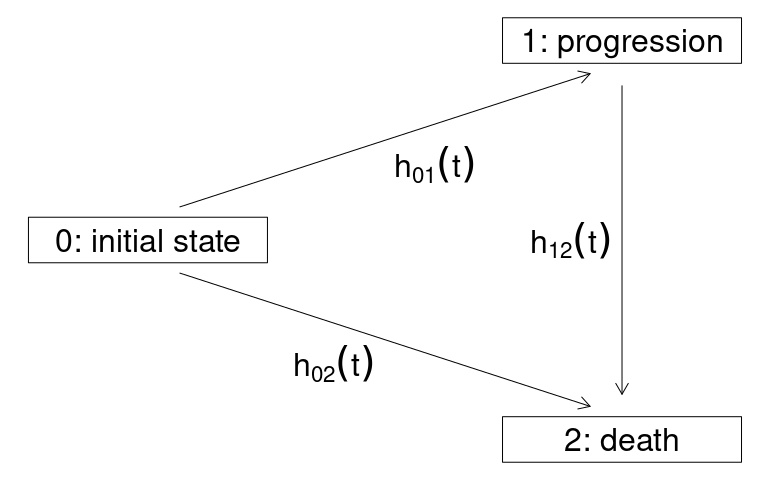
simIDM v0.0.5: Provides functions to simulate oncology trials using an illness - death model. See Meller, Beyersmann and Rufibach (2019) for background and the vignettes Getting Started and Power and Type 1 Error Correlations.
Science
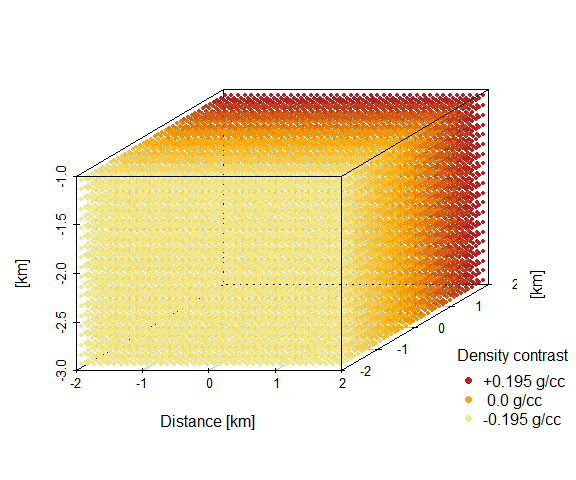
gravmagsubs v1.0.1: Provides functions to compute the gravitational and magnetic anomalies generated by 3-D vertical rectangular prisms at specific observation points using the method of Plouff (1976). See the vignette.
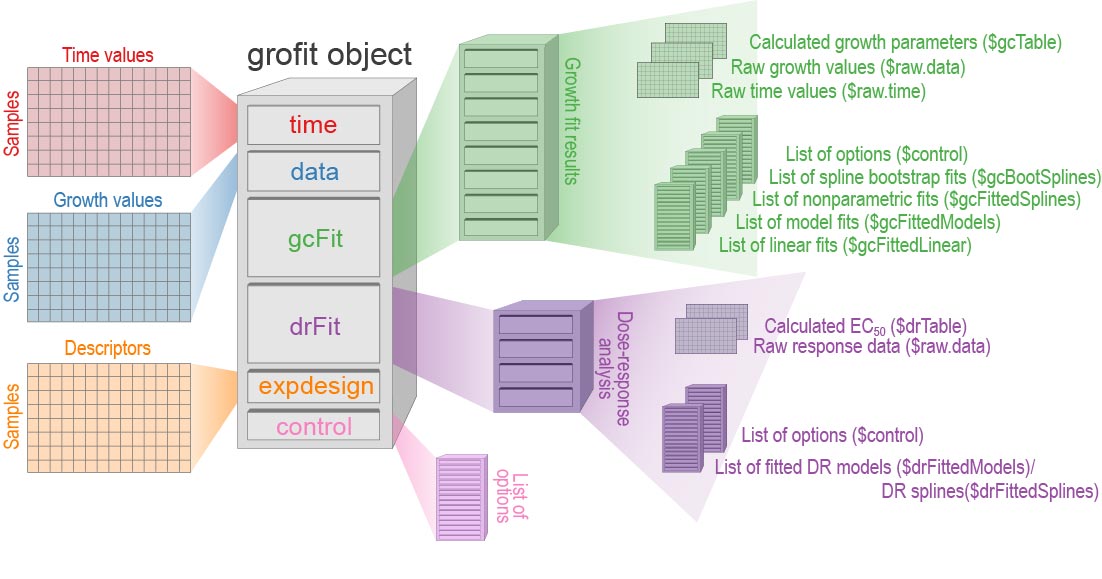
QurvE v1.0: Implements three methods for solving high-throughput analysis of growth curves and fluorescence data: linear regression, growth model fitting, and smooth spline fits. A shiny application provides access to all features without requiring any programming knowledge. There is a User Manual and there are vignettes on Flouresence Curve Evaluation and Growth Curve Evaluation.
Statistics
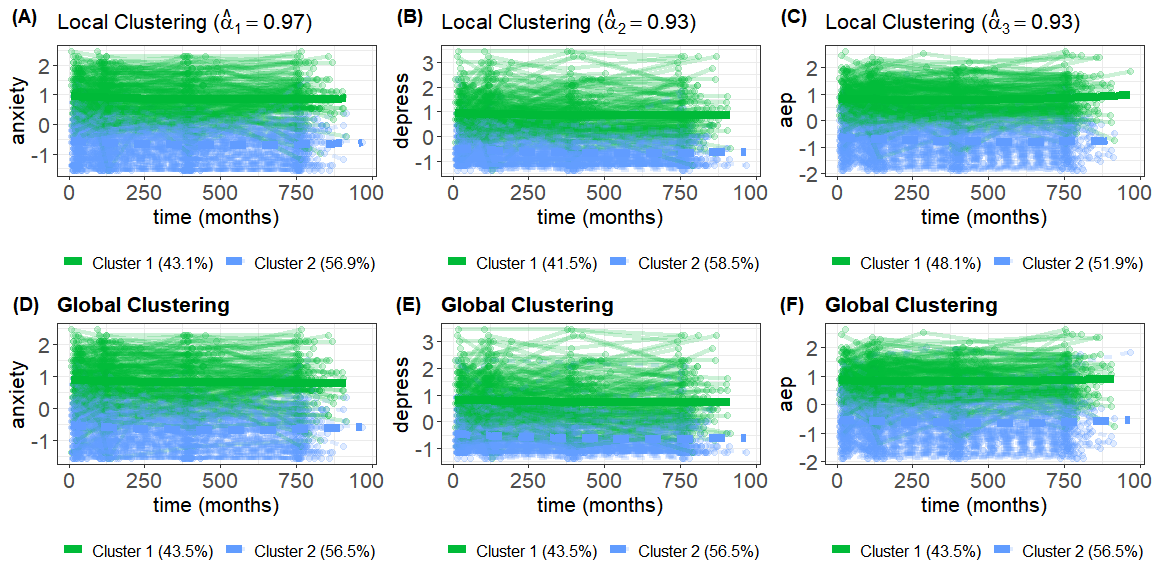
BCClong v1.0.0: Implements a Bayesian consensus clustering (BCC) model for multiple longitudinal features via a generalized linear mixed model that allows simultaneous clustering of mixed-type (e.g., continuous, discrete and categorical) longitudinal features. There are vignettes for continuous and mixed type data.
clarify v0.1.2: Provides functions to perform simulation-based inference as an alternative to the delta method for obtaining valid confidence intervals and p-values for regression post-estimation quantities such as average marginal effects and predictions at representative values. The methodology is described in King et al. (2000). See the vignette for examples.

emplikAUC v0.3: Provides functions to test hypotheses and construct confidence intervals for AUC (Area Under receiver operating characteristic curve) and pAUC (partial area under ROC curve) using the method described in Zhao, Ding & Zhou .
jtdm v0.1-0: Implements The Joint Trait Distribution Model in a Bayesian framework using conjugate priors to compute joint probabilities and multivariate confidence intervals. See the vignette.
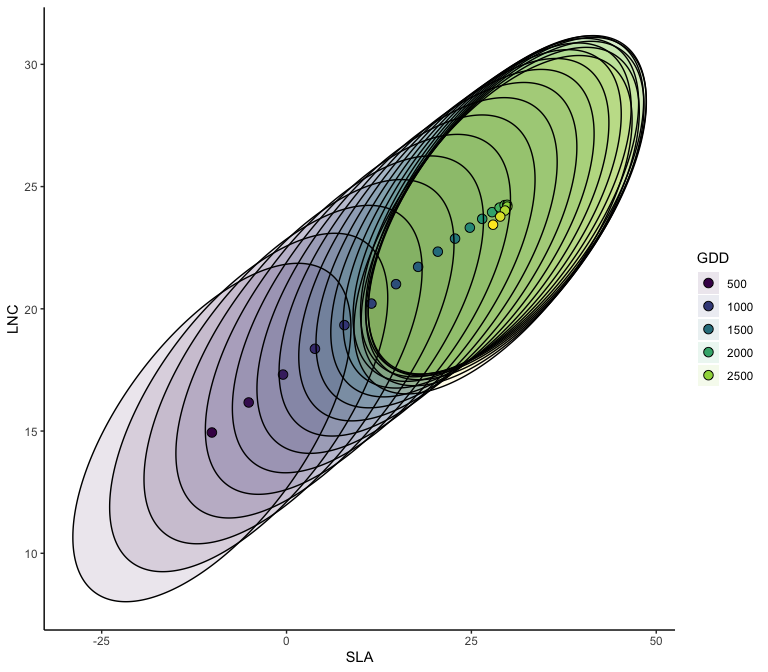
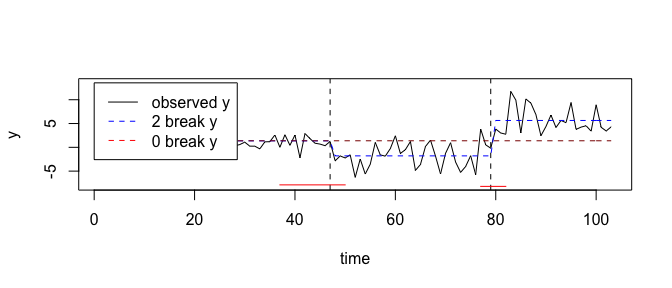
mbreaks v1.0.0: Functions provide comprehensive treatments for estimating, inferring, testing and selecting linear regression models with structural breaks. See Bai & Perron (1998) for background and the vignette examples.
sdmTMB v0.3.0: Implements spatial and spatiotemporal predictive-process GLMMs (Generalized Linear Mixed Effect Models) using TMB, INLA, and the SPDE (Stochastic Partial Differential Equation) approximation to Gaussian random fields. See Anderson et al. (2022) for background and the vignette for examples.
snapKrig v0.0.1: Provides functions for geostatistical modeling and kriging with gridded data using spatially separable covariance Kronecker covariance functions. See Koch, Lele, Lewis (2020) for descriptions of the computational methods and the vignette for examples.

Time Series
fnets v0.1.2: Implements methods for network estimation and forecasting of high-dimensional time series exhibiting strong serial and cross-sectional correlations under a factor-adjusted vector autoregressive model. See Barigozzi et al. (2022) for the methodology and Owens et al. (2023) for details of the package.
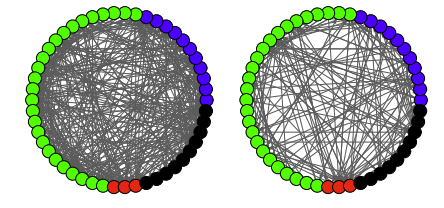
MSinference v0.0.9: Provides functions to perform multiscale analysis of a nonparametric regression or nonparametric regressions with time series errors. See Khismatullina and Vogt (2020), Khismatullina and Vogt (2022) and Khismatullina and Vogt (2023) for the theory and examples, and the vignette to get started.
Utilities
datetimeoffset v 0.2.1: Provides support for a number of datetime string standards including ISO 8601 and pdfmark and also datetimes with UTC offsets and possibly heterogeneous time zones with up to nanosecond precision. See the package Introduction.
mathml v0.5: Provides functions to translate R expressions to MathML or MathJax so that they can be rendered in rmarkdown documents and shiny applications. See the vignette
options v0.0.1: Provides a simple mechanisms for defining and interpreting package options, including helper functions for interpreting environment variables, global options, defining default values and more. See the vignettes environment variables and options.
parquetize v0.5.3: Provides functions to convertcsv, RData, rds, RSQLite, json, ndjson, SAS, SPSS and other files to the Parquet columnar storage format. See the vignette.
scenes v0.1.0: Provides functions to facilitate switching between shiny UIs depending on the information that is to be passed to the request object. See the vignettes Creating new actions and Changing scenes.
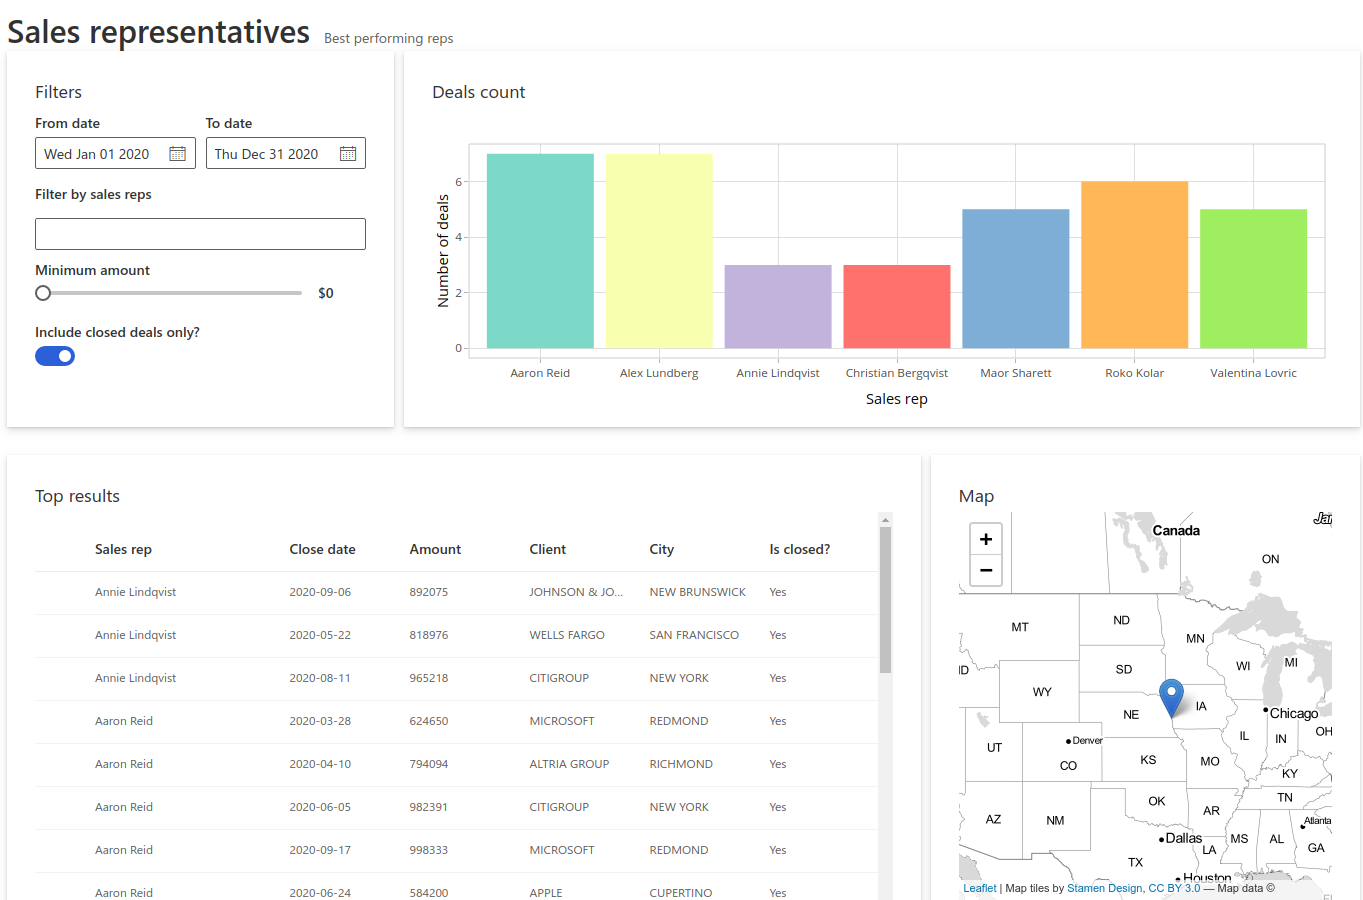
shiny.fluent v0.3.0: Provides shiny components based on the Fluent UI JavaScript library. There are several small vignettes including a Tutorial on creating a full dashboard with shiny and Fluent.
Visualization
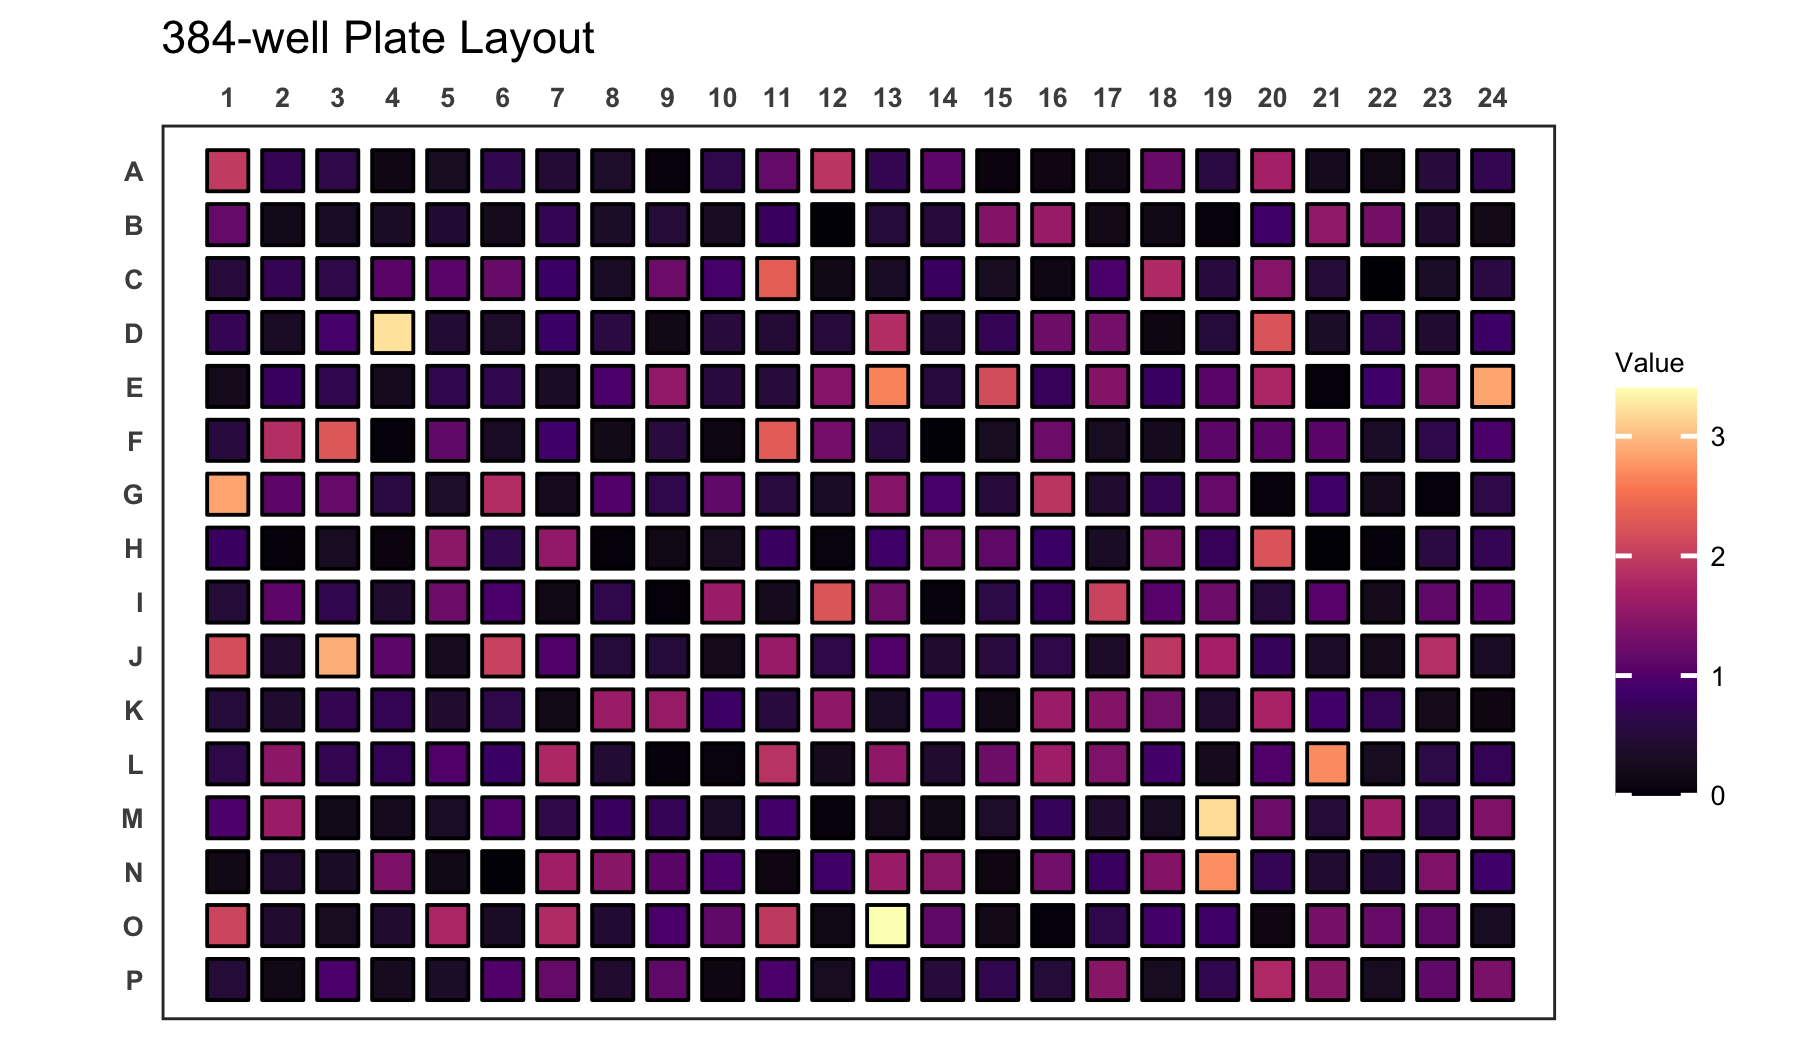
ggplate v0.0.1: Provides functions to create simple plots of biological culture plates as well as microplates which can plot both continuous and discrete values. See README for examples.
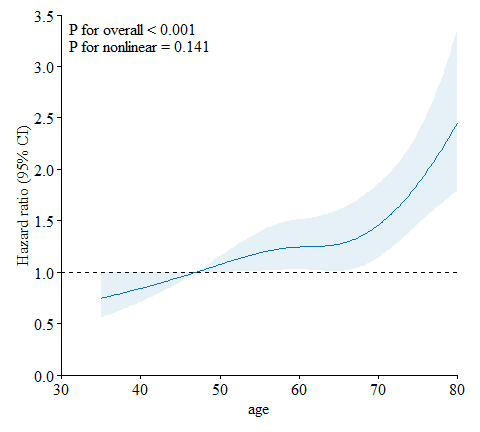
plotRCS v0.1.3: Extends ggplot2 to draw restricted cubic spline curves from a logistic regression model or a Cox proportional hazards regression model using the method described in Harrell (2015). Look here for examples.
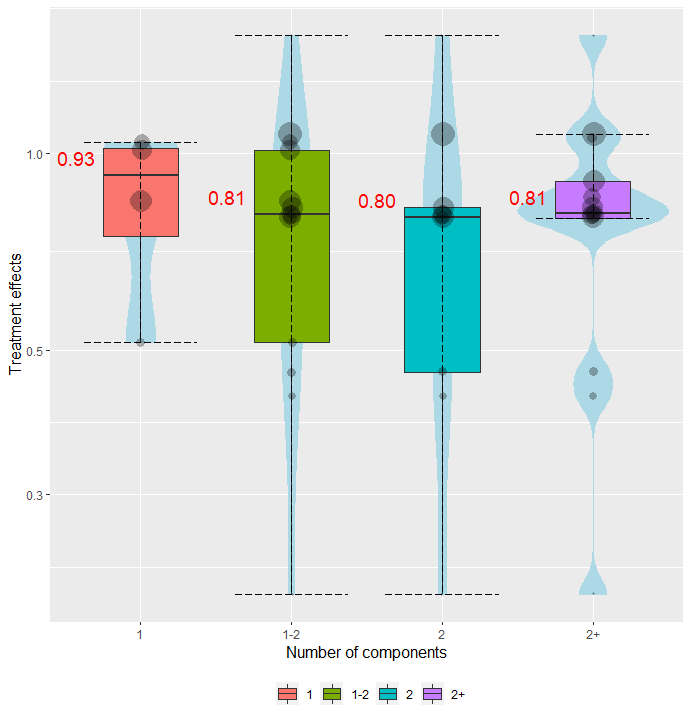
viscomp v1.0.0: Implements several visualization tools for exploring the behavior of the components in a network meta-analysis of multi-component interventions including heat plots of the two-by-two component combinations, leave one component combination out scatter plot, violin plots for specific component combination effects, and density plots for components effects. See the vignette for examples.
You may leave a comment below or discuss the post in the forum community.rstudio.com.